

Blog Details

What is the Historical Flow Dashboard ? - Flowtopia
Real-time data can help traders understand what is happening in the market right now, but it does not always explain how positioning has been building over time. In many cases, the broader context behind unusual activity becomes clearer when past options flow is reviewed across multiple sessions rather than in isolation.
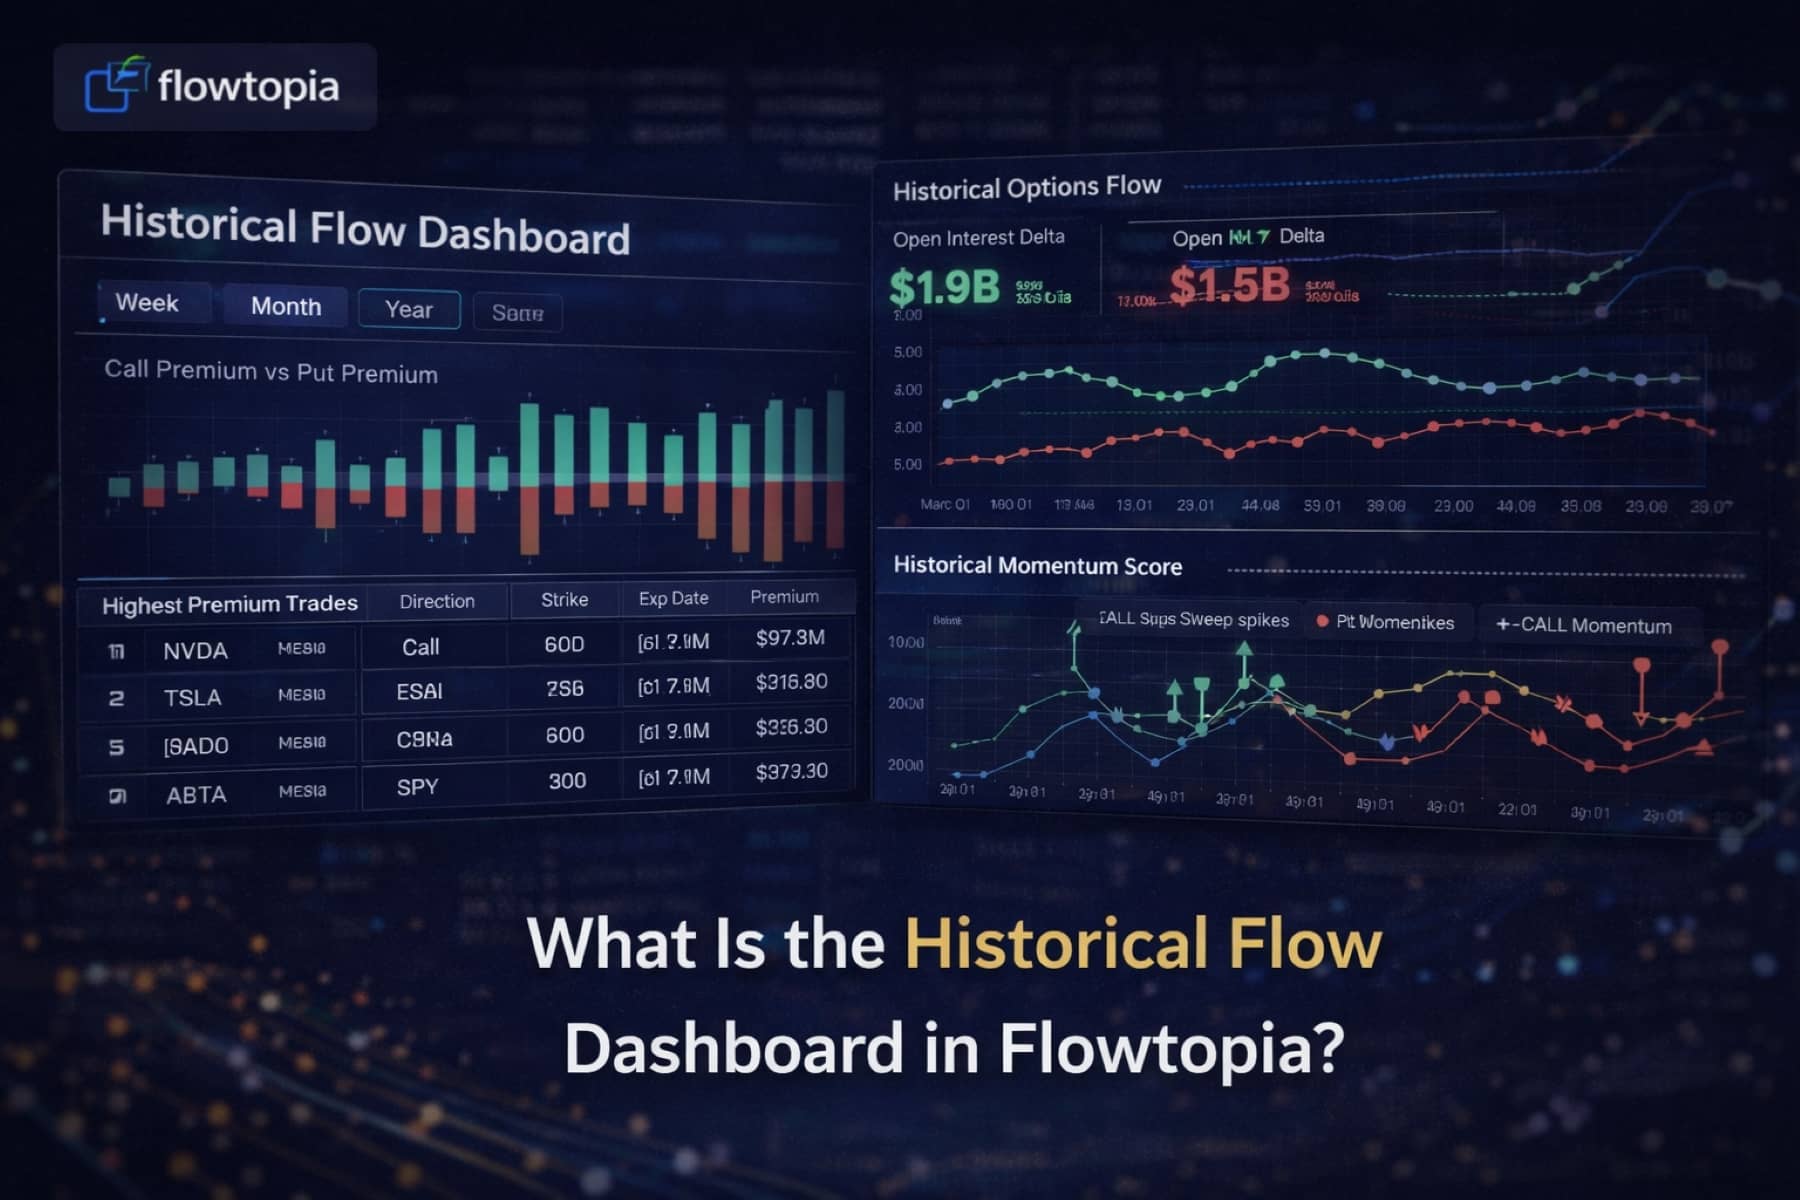
That is where the Historical Flow Dashboard in Flowtopia becomes useful. Instead of forcing traders to manually sort through old trades, it organizes historical options activity into a clearer structure so recurring patterns, repeated positioning, and changes in behavior are easier to study.
By stepping back from isolated trades and comparing activity across different timeframes, traders can build a better understanding of where capital has been moving, how interest has developed, and whether similar behavior has appeared before under comparable market conditions.
What Is Historical Options Flow?
Historical options flow refers to previously recorded options transactions that can be reviewed across different timeframes. Instead of focusing only on one trading session, traders can use this data to study how activity develops over days, weeks, or longer periods.
Key Components of Historical Options Flow
- trade size and premium.
- strike price and expiration.
- execution behavior.
- timing and frequency of trades.
By analyzing historical options activity, traders can identify recurring patterns under similar market conditions. These patterns do not always produce clear or immediate outcomes, but they can provide meaningful context when interpreting current market behavior.
For example, if certain strike prices consistently attract large options trades over multiple sessions, it may indicate sustained interest rather than short-term speculation.
Why Historical Options Flow Matters in Options Flow Analysis
Looking at a single trade or a single session can often lead to incomplete conclusions. Market activity rarely happens in isolation and is often part of a broader positioning process that develops over time.
Historical options flow matters because it helps traders compare current activity with what has happened before. Instead of reacting to individual trades, they can study whether similar patterns have appeared repeatedly across multiple sessions and decide whether that activity deserves more attention.
Comparing Short-Term vs Long-Term Activity
For instance, a sudden spike in volume might seem important in real time. However, if similar spikes have occurred frequently without meaningful follow-through, the signal may carry less weight. On the other hand, consistent activity at specific levels over several sessions may suggest more deliberate positioning.
That comparison is one of the main reasons historical flow analysis is useful. It helps traders filter out noise and focus more on patterns that appear persistent rather than isolated.
How the Historical Flow Dashboard Works
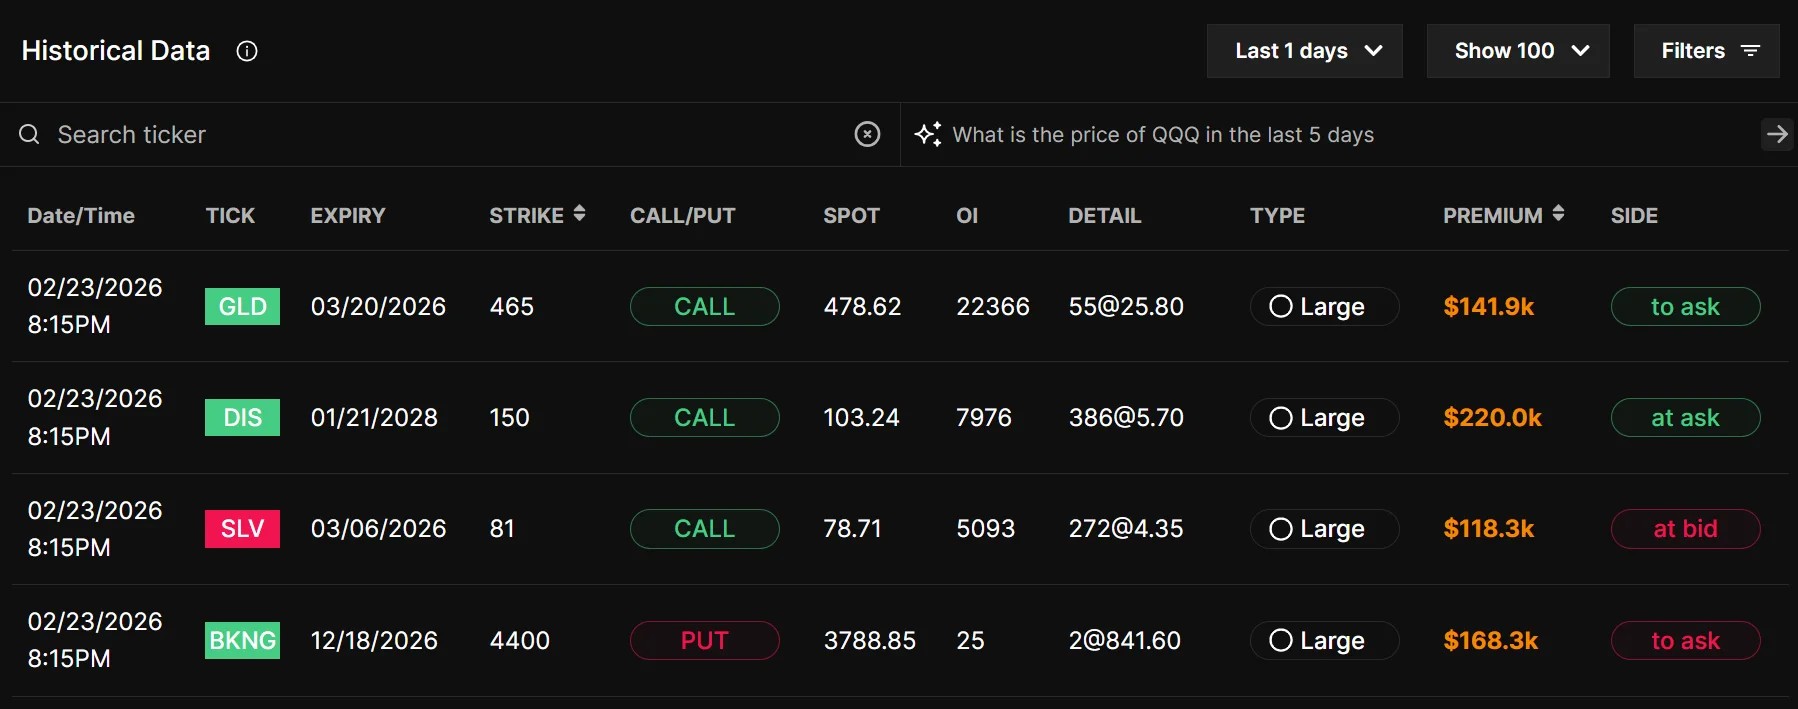
The historical flow dashboard is designed to transform large amounts of raw historical options flow data into a format that is easier to analyze, often through structured options flow tools.
Structured Data Analysis
Instead of manually reviewing thousands of historical trades, traders can use the dashboard to filter data by timeframe, compare one period with another, and study how flow develops over time. This structured approach makes it easier to reduce noise, surface recurring behavior, and focus on the activity that appears more persistent or more meaningful.
Consistency in Analysis
One of the main benefits of using a dashboard is that it creates a more repeatable process. Rather than reacting to isolated trades, traders can review historical activity in a more consistent way and compare current setups with what has happened before under similar conditions.
Key Features of a Historical Flow Dashboard
Time-Based Analysis
One of the most useful features of the Historical Flow Dashboard is the ability to review activity across different timeframes. Traders can examine a single session, compare multiple days, or step back to study broader positioning trends.
That flexibility makes it easier to understand how short-term activity fits into a longer-term pattern rather than treating each session as a separate event.
Pattern Recognition Across Sessions
The Historical Flow Dashboard makes it easier to identify patterns that repeat over time. These may include consistent activity at certain strike prices, recurring interest in similar expirations, or volume that continues to build across multiple sessions.
Why Repeated Positioning Matters
When similar activity continues to appear across multiple sessions, it may suggest more sustained positioning rather than short-term speculation. That can be especially useful when traders want to understand whether larger participants may be building interest gradually over time instead of reacting in a single burst of activity.
Trade Clustering and Repetition
Another important feature is the ability to identify clusters of trades across multiple sessions.
To better evaluate these patterns, traders often review structured datasets through tools like the top flow leaderboard, which highlight large trades and repeated activity.
How Traders Use Historical Options Flow
Traders usually use historical flow analysis as part of a broader workflow rather than as a standalone input. The goal is to compare current market behavior with past activity and decide whether similar patterns may be developing again.
Step 1: Identify Recurring Activity
The first step is to identify activity that repeats across multiple sessions. This may include consistent trades at certain strike prices or gradual increases in volume.
Step 2: Compare With Current Conditions
Next, traders compare historical patterns with current market behavior. If similar activity appears under similar conditions, it may provide stronger context.
Step 3: Evaluate Changes Over Time
Instead of focusing on a single trade, traders observe how positioning evolves across timeframes.
Step 4: Avoid Overinterpretation
Even with historical options flow data, interpretation requires caution. A pattern may look important in one context and far less useful in another.
Common Insights from Historical Options Activity
- repeated interest at specific strike prices
- gradual changes in volume over time
- shifts in expiration preferences
- evolving execution behavior
These insights help traders understand how broader positioning trends may be developing. When similar patterns continue across sessions, it may indicate sustained positioning rather than short-term speculation.
Linking Patterns to Price Behavior
In addition, observing how these patterns interact with price can provide further context. For example, consistent positioning at a level that later acts as support or resistance may offer insight into how liquidity develops.
Limitations of Historical Options Flow Analysis
Incomplete Information: Many trades are part of multi-leg strategies, meaning a single transaction does not show the full position.
Interpretation Challenges: Without sufficient experience, it can be difficult to distinguish meaningful signals from noise.
Changing Market Conditions: Patterns that appear relevant in one environment may not behave the same way in another. Traders must continuously reassess their interpretations.
Combining Historical Flow with Other Tools
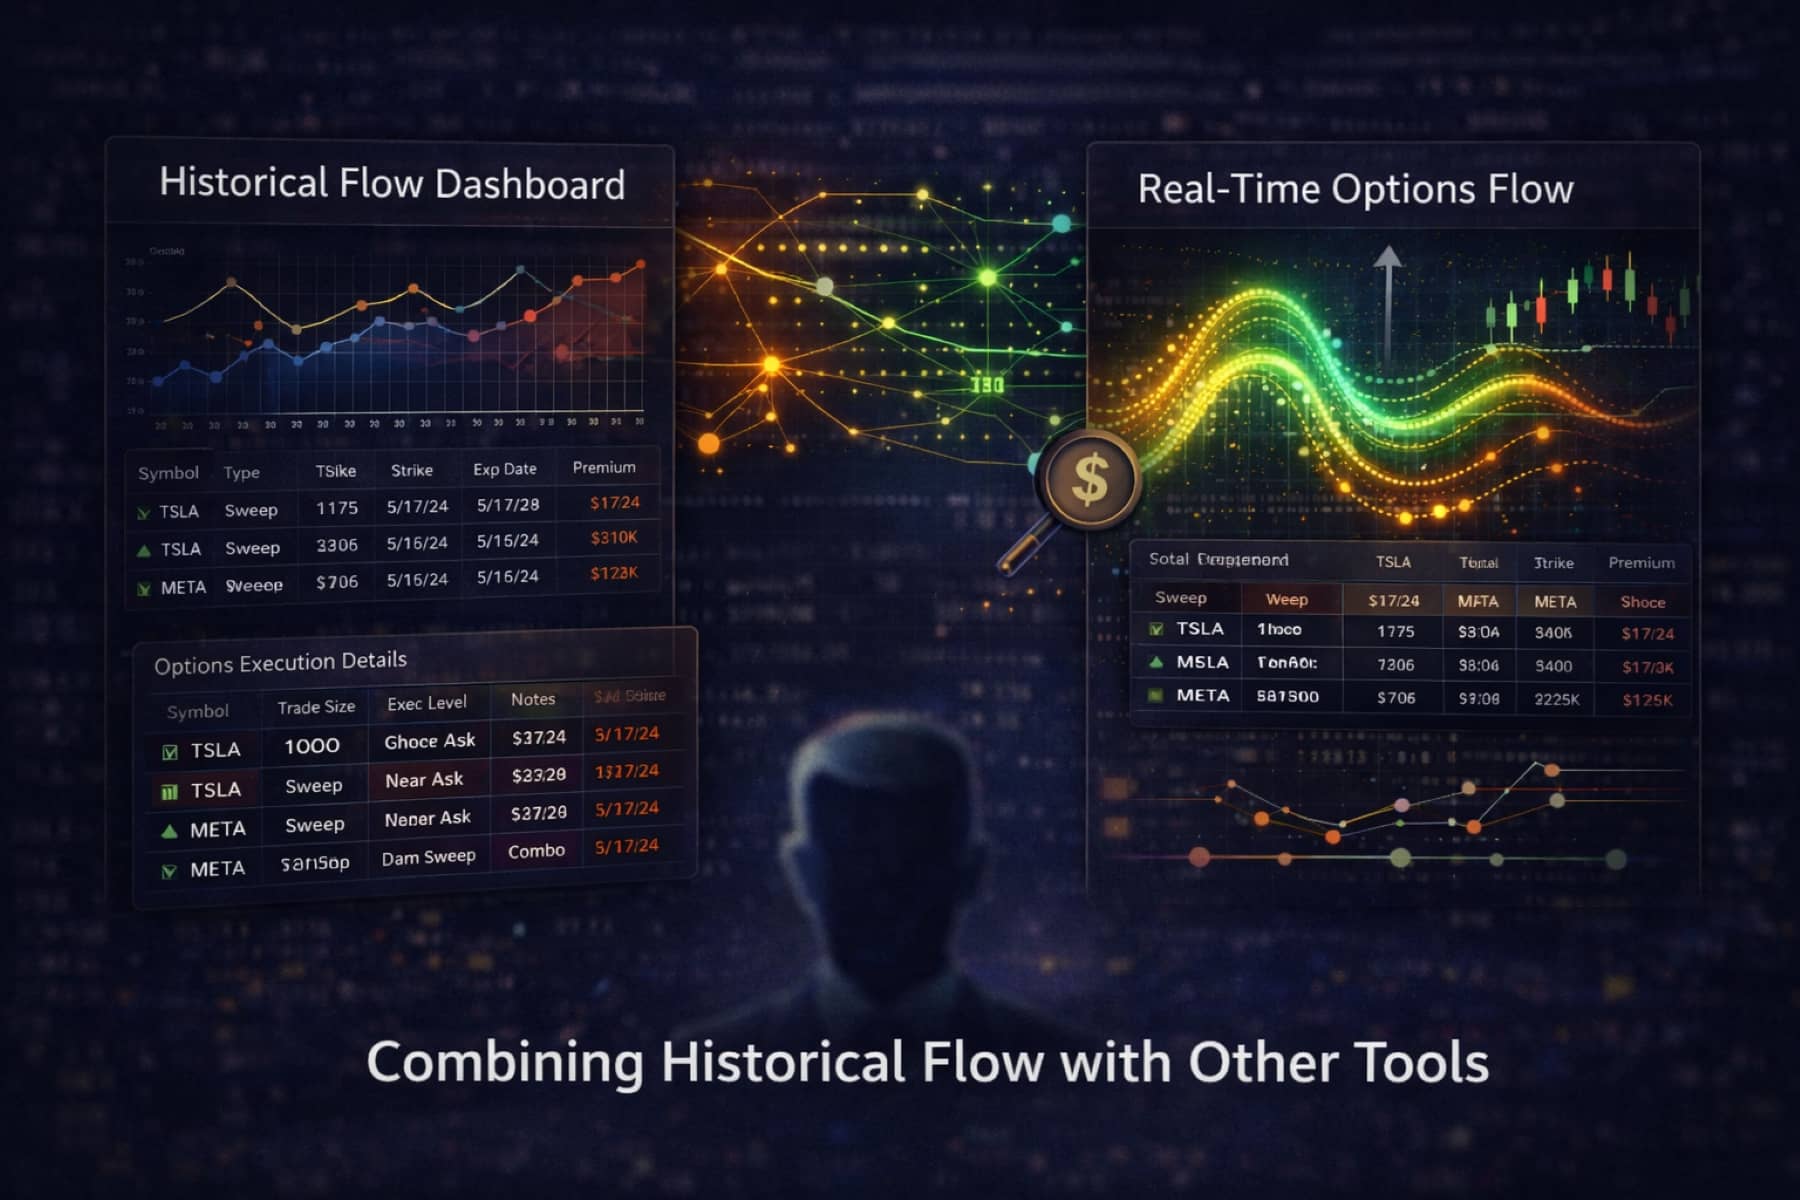
To develop a more complete understanding of market behavior, traders often combine Historical Flow Dashboard analysis with other tools.
For example, execution-level views can help clarify how trades were structured, while real-time flow tools can show whether historical patterns are starting to reappear in the current session. Used together, these tools make it easier to connect past behavior with current positioning.
Building a Multi-Layered View
Looking at the market from multiple analytical angles can make it easier to understand how capital is moving, how different forms of activity interact, and whether current behavior looks isolated or part of a broader pattern.
When Historical Options Flow Is Most Useful
Historical flow analysis is often most useful:
- during periods of elevated volatility.
- around earnings announcements.
- when reviewing longer-term positioning trends.
- when current activity begins to resemble patterns seen in previous sessions.
Real Market Example
For example, during earnings season, traders may notice repeated positioning at the same strike across several sessions leading into an event. If that activity continues to build over time, the Historical Flow Dashboard can help show that the interest is not isolated to one day, but part of a broader pattern that may deserve closer attention.
Conclusion
Historical options flow gives traders a broader way to understand how positioning develops over time. While real-time data captures what is happening now, the Historical Flow Dashboard helps reveal whether similar activity has been building across multiple sessions.
By organizing past options activity into a structured view, the dashboard makes it easier to move beyond isolated trades and study how capital has been allocated across different timeframes. It does not provide certainty, but it can add meaningful context when traders want to compare current behavior with what has happened before.
Used alongside real-time flow and other supporting tools, Historical Flow Dashboard can help traders build a more practical and more consistent framework for options flow analysis.
Similar Blog You
May Like
Understand how institutional money moves and turn complex options data into clear, actionable insights in real time.


Join traders using real-time options flow, institutional data, and advanced tools to make faster, more informed decisions.