
Dealer Positioning. Gamma Levels. Market Structure
GEX (Gamma Exposure)


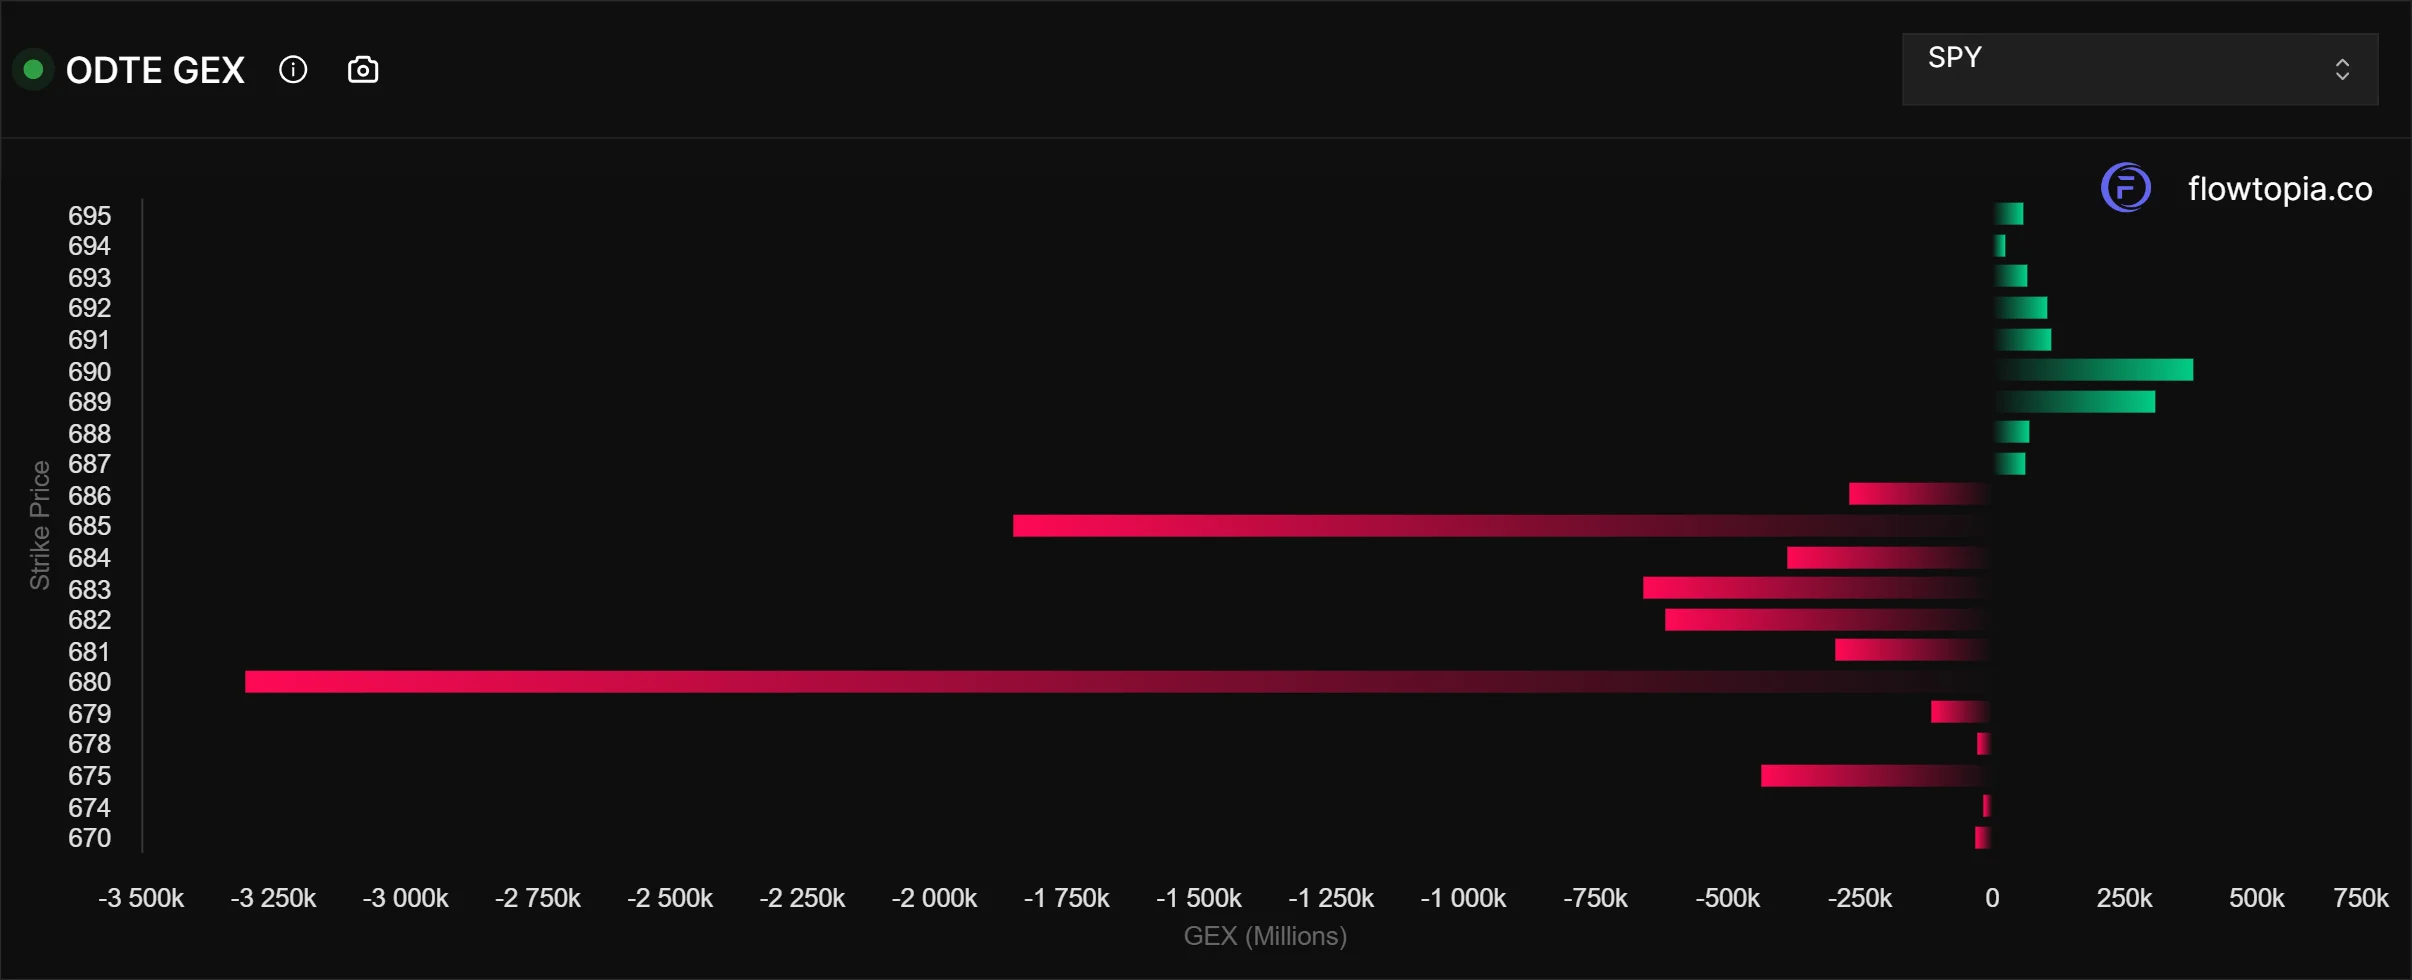
The GEX view is designed to make gamma exposure easier to interpret in live market conditions. By showing how exposure is distributed across important price levels, it helps traders quickly identify where dealer positioning may have a stronger influence on support, resistance, and short-term market behavior. Instead of treating gamma as an abstract concept, this view turns it into a clearer structure that can be used to better understand how hedging pressure may interact with price.
✅ See where gamma exposure is concentrated across key price levels.
✅ Identify areas where dealer hedging may influence support and resistance.
✅ Add more structure to how you read short-term market behavior.
GEX, or Gamma Exposure, is a way of understanding how dealer positioning may influence price behavior around important levels. By showing where gamma is concentrated, it gives traders more context around how options hedging activity may affect support, resistance, and the way price responds as it approaches key strikes.
That matters because market structure is not driven by price alone. In many cases, dealer hedging pressure can shape how smoothly price moves, where it tends to stall, and where volatility may begin to expand. A clearer view of gamma exposure helps traders approach these levels with more context and a better understanding of how positioning may be influencing the session.
By showing how gamma exposure is distributed, it adds context to the broader structure of the market and highlights where dealer positioning may begin to influence the way price behaves around important areas.
It helps identify whether positioning appears more supportive or more unstable at different price levels, giving traders a clearer sense of how market behavior may shift as price moves through those areas.
When gamma is concentrated around certain strikes, those areas can become more relevant as potential support or resistance, especially when price begins to approach them during the session.
Gamma exposure can also help explain where price may move more smoothly and where it may become more reactive, giving traders additional context around possible volatility expansion.
By showing where hedging activity may become more active, it can help explain why price sometimes slows, pins, accelerates, or reacts differently near important levels.
For a deeper look at what GEX is, how it works, and how traders use gamma exposure in practice, read the full guide: What Is GEX (Gamma Exposure)? Explained for Traders
This tool is most useful when it is treated as a framework for reading market structure, not as a standalone signal. The goal is not to react to every gamma level in isolation, but to understand how exposure is distributed, where hedging pressure may matter most, and how those levels may interact with price during the session.
Start by locating the price levels where exposure appears most concentrated. These areas often matter more because dealer positioning may have a stronger influence on how price behaves as it approaches them.
Once key levels are visible, the next step is to understand whether positioning appears more supportive or more unstable. This can help traders build context around where price may be more likely to slow down, react, or become more sensitive.
This data becomes more useful when viewed alongside price action. If price is approaching an important gamma level, traders can watch how the market responds around that area instead of assuming the level will matter on its own.
Rather than treating it as a direct entry signal, traders often use it to frame support, resistance, volatility risk, and the broader environment around a setup. It works best as context that improves interpretation, not as a shortcut to decision-making.
This tool is designed to give traders more context around how the market may behave near important price levels. Instead of relying only on chart structure, it adds a positioning-based view that can improve how support, resistance, and short-term volatility conditions are interpreted.
1️⃣ Anticipate more meaningful price zones by highlighting areas where exposure is more concentrated.
2️⃣ Add structure to volatility expectations by showing where price may behave more smoothly or become more reactive.
3️⃣ Improve context around support and resistance by helping distinguish which areas may carry more weight.
4️⃣ Support more disciplined trade planning by framing market structure with more positioning-based context.
GEX is built for traders who want more context around market structure than price action alone can provide. It is especially useful for people who pay close attention to support and resistance, volatility conditions, and the way dealer positioning may influence price behavior during the session. Rather than acting as a simple directional signal, this tool is better suited for traders who want a more structured view of how the market may respond around important levels.
GEX becomes more useful when it is viewed alongside other tools that add context to market structure and positioning. While this feature helps traders understand gamma exposure and key market levels, related tools can help explain how flow is developing, where momentum may be shifting, and whether similar behavior has appeared before.
✅ Real-Time Options Flow: Use real-time flow data to see how unusual activity, premium concentration, and changing positioning may be developing around key gamma levels during the session.
✅ Wave Indicator: Add a momentum-based view of options flow to better understand whether sentiment and pressure appear to be strengthening, weakening, or starting to shift.
✅ Top Flow Leaderboard: Surface the tickers and contracts drawing the most notable options activity so you can connect gamma levels with where market attention is concentrating.
✅ Historical Dashboard: Review past flow behavior across multiple sessions to study whether similar positioning patterns have appeared before and how those levels behaved over time.
Join traders using real-time options flow, institutional data, and advanced tools to make faster, more informed decisions.