
Backtest setups with historical flow data
Historical Dashboard


Historical Dashboard is a historical options flow analysis tool built for traders who want to study past activity, backtest ideas, and validate setups with more context.
Rather than relying only on live flow, traders can use it to review how options activity appeared in earlier sessions, compare recurring patterns, and better understand how past positioning may have developed over time.
By making historical options data easier to search and analyze, the tool helps traders move from raw past activity to more structured research and deeper trade evaluation.
Historical Dashboard helps traders move beyond live observation and build a deeper understanding of how options activity has behaved over time.
By reviewing past flow, traders can compare recurring behavior, backtest trade ideas, and study how earlier positioning may have influenced later market movement. This makes it easier to validate setups, refine strategy development, and avoid relying only on what is happening in the current session.
For traders who want more historical context behind their decisions, the tool provides a more structured way to research past market behavior and evaluate ideas with greater confidence.
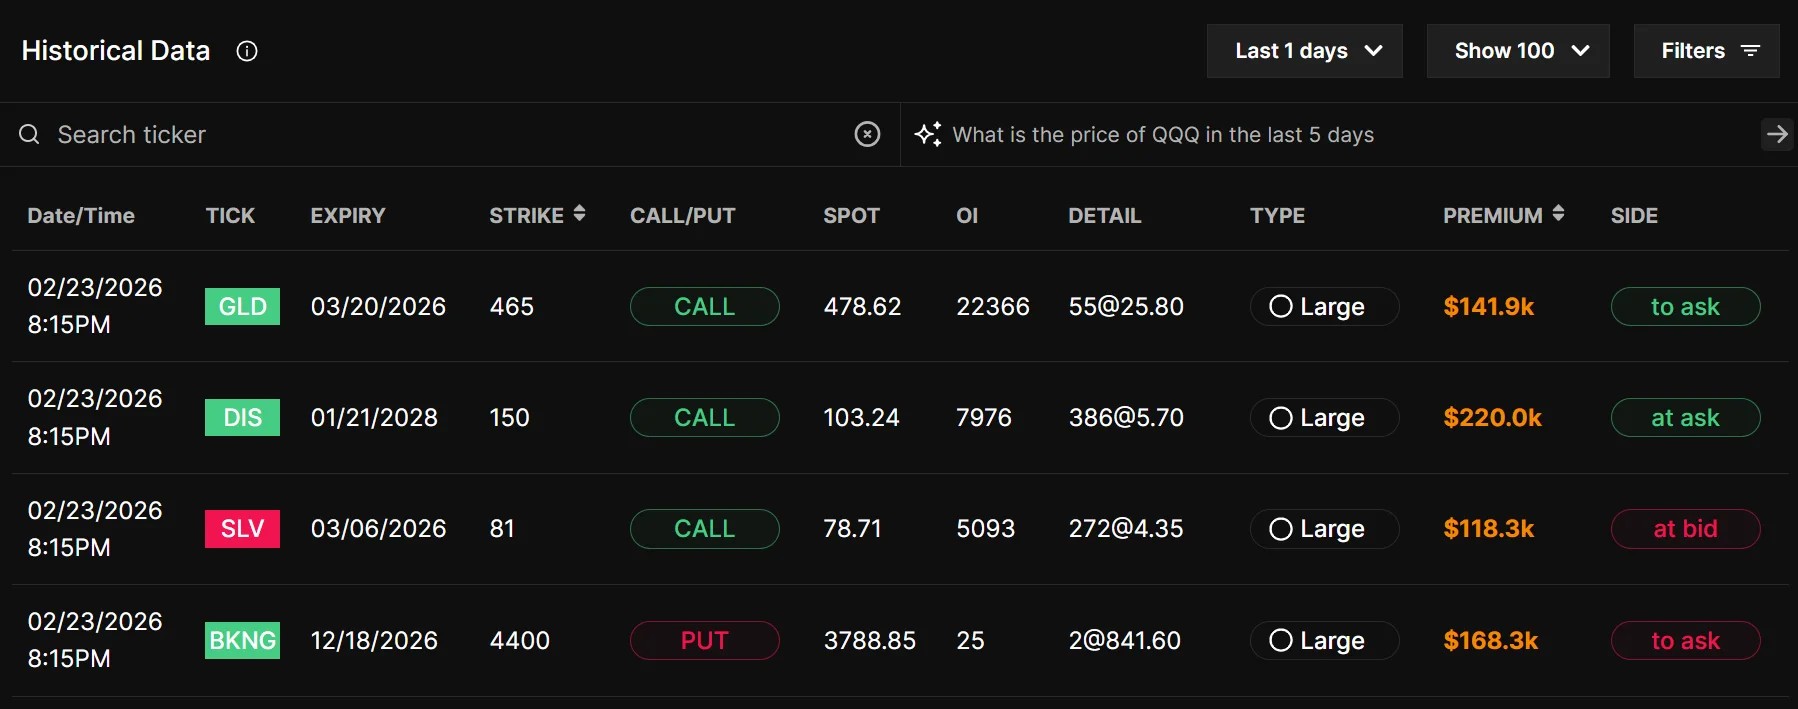
Traders can start by selecting a ticker and then narrow the data using filters such as date range, premium size, contract type, and expiration. Once the dataset becomes more focused, they can review how earlier flow developed and compare past activity across different periods or setups.
By organizing historical options data into a more usable view, the tool helps traders backtest ideas more efficiently and study recurring patterns with clearer context.
If you want a more detailed explanation of how Historical Dashboard works and how traders use historical flow data for backtesting and setup validation, read our full guide on the Historical Flow Dashboard.
Historical Dashboard makes historical flow analysis more practical by helping traders narrow past options activity through the filters and views that matter most during research.
✅ Ticker: Review historical flow for a specific symbol and keep analysis focused on the names tied to the setup being studied.
✅ Date Range: Filter activity across selected time periods to examine how flow developed around earlier sessions, events, or broader market conditions.
✅ Premium Size: Narrow historical trades by premium value to isolate larger activity and better identify where more significant positioning may have taken place.
✅ Contract Type: Separate calls and puts to compare how directional positioning may have appeared across past activity.
✅ Expiration: Analyze how historical flow was distributed across near-term and longer-dated contracts.
Used together, these filters make it easier to search large datasets, compare historical behavior, and evaluate past setups with clearer context.
Historical Dashboard helps traders move beyond live observation by giving them a more structured way to study how options activity behaved in the past.
Review earlier flow activity to see how similar setups developed across past sessions and evaluate whether current ideas align with historical behavior.
Study repeated flow behavior across different periods to identify whether certain types of activity tend to appear in similar ways over time.
Examine how options flow developed around earnings, major news, or volatile market periods to add more context to event-based setups.
Compare historical call and put activity to better understand how bullish or bearish positioning may have been distributed during earlier market conditions.
Use historical flow analysis as part of a deeper research process before combining it with price action, volatility, or other tools used to evaluate the setup.
Historical Dashboard is designed for traders who want to go beyond live observation and build a more research-driven understanding of how options activity has behaved over time.
1️⃣ Options flow traders: Traders who follow flow-based setups can use historical data to compare current activity with earlier patterns and better understand whether a setup looks familiar or isolated.
2️⃣ Backtest-focused traders: For traders who want to test ideas more carefully, the tool makes it easier to review how similar setups developed across past sessions and market conditions.
3️⃣ Research-oriented traders: Historical Dashboard is useful for traders who prefer a more structured workflow and want to analyze recurring behavior with stronger historical context.
4️⃣ Event-driven traders: Traders studying earnings, major announcements, or volatile sessions can use the tool to examine how options activity behaved around those periods in the past.
5️⃣ Process-based traders: For traders who rely on repeatable research and setup validation, the tool helps connect historical behavior with more disciplined strategy development.
Real-Time Options Flow: Track live options activity and compare it with the historical behavior you are studying to see whether similar patterns may be developing again.
Top Flow Leaderboard: Use ranked market activity to identify which tickers deserve closer attention before comparing current flow with past behavior.
Contract Tape: Look more closely at execution-level activity and review how individual trades are unfolding when current setups begin to resemble earlier patterns.
Option Surfer: Filter contracts across strikes and expirations more efficiently before connecting those contracts to a broader historical analysis workflow.
WAVE Indicator: Add broader context by viewing historical options behavior alongside wider market conditions and positioning trends.
Join traders using real-time options flow, institutional data, and advanced tools to make faster, more informed decisions.