

Blog Details

WAVE Indicator Explained: How to Track Smart Money Flow - Flowtopia
Most retail traders react to market movements only after a trend has already begun. Professional traders and large market participants often enter positions before major price moves occur. Large hedge funds, asset managers, and proprietary trading firms analyze economic data, corporate fundamentals, and derivatives activity to identify opportunities before the broader market does.
Because these institutions control enormous amounts of capital, their trades frequently influence price movements across financial markets.
This raises an important question for many traders: how can individual investors identify what smart money is doing before the market reacts?
For years, answering this question was extremely difficult. Large institutional firms operate with advanced research infrastructure, proprietary analytics models, and access to sophisticated data sources that individual traders rarely see. These advantages allow large market participants to react faster to new information and deploy capital before most retail traders even notice the opportunity.
However, the rapid growth of derivatives analytics platforms has begun to change this dynamic.
One of the clearest places to observe institutional behavior is the options market. Options contracts allow investors to express bullish or bearish expectations while controlling leverage and risk exposure. When large investors accumulate significant options positions, those trades can reveal valuable signals about future market sentiment.
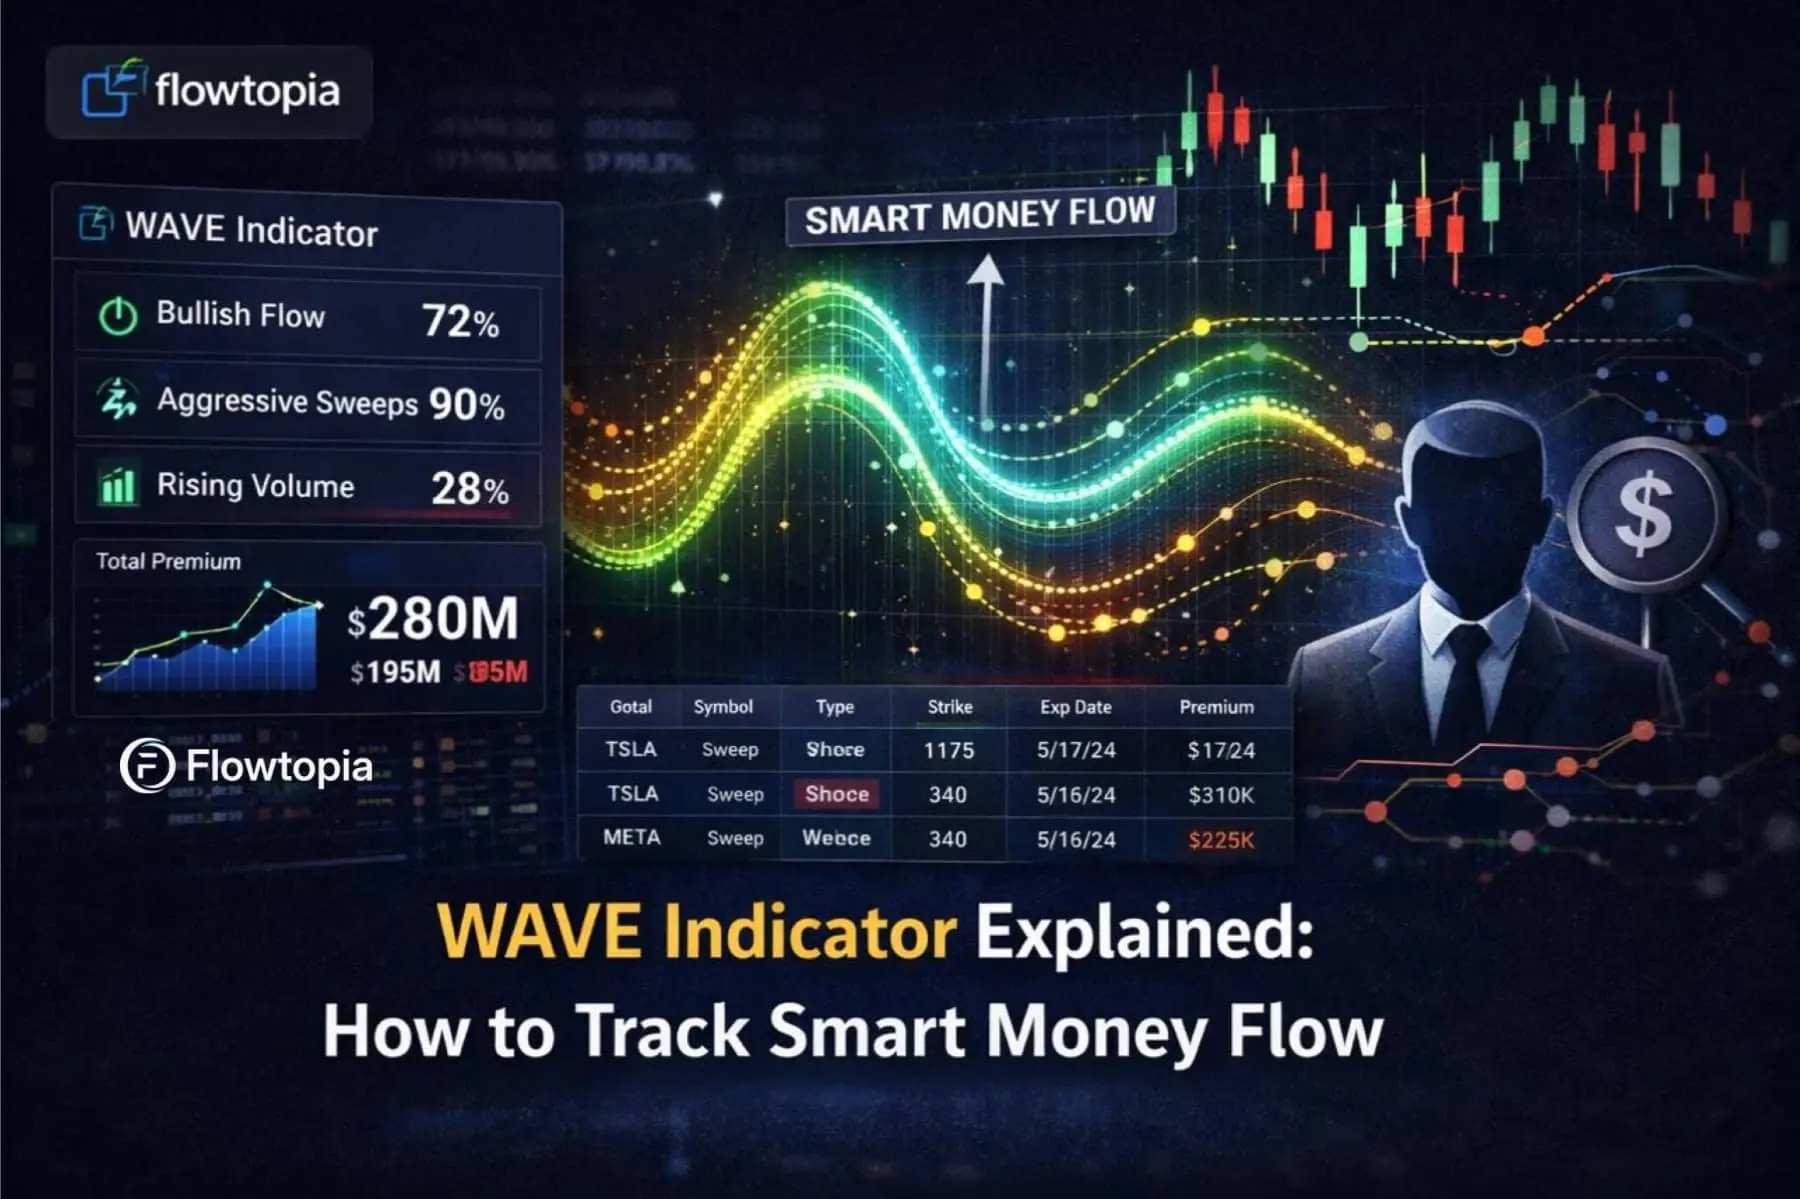
The WAVE Indicator was created to help traders interpret these signals more clearly.
Instead of manually analyzing thousands of options trades across multiple strike prices and expirations, the WAVE Indicator aggregates key options flow metrics into a simplified view of institutional momentum. By tracking how capital moves through derivatives markets, traders can gain insight into changes in options market sentiment before price trends become obvious on traditional charts.
Understanding how to track smart money in the options market gives traders clearer insight into how professional investors position themselves.
What Is the WAVE Indicator
The WAVE Indicator is a smart money flow indicator designed to analyze options order flow and highlight potential changes in institutional sentiment.
In simple terms, the indicator examines institutional trading activity to identify where large amounts of capital are being deployed within the derivatives market.
It functions as an advanced analytics tool that helps traders interpret large-scale derivatives transactions and understand institutional positioning in the options market. By analyzing patterns in institutional order flow, the indicator helps reveal whether professional investors are building bullish or bearish positions.
Every trading day the options market produces enormous volumes of transactions. According to data published by the Options Clearing Corporation (OCC), millions of options contracts are traded daily across U.S. exchanges. These trades represent billions of dollars in notional exposure and reflect a wide range of trading strategies.
Professional money managers rely heavily on derivatives markets because options contracts provide flexibility and capital efficiency. Through options trading, investors can hedge portfolio risk, speculate on price movements, or construct sophisticated trading strategies that would be difficult to execute using stock positions alone.
Because institutional traders frequently execute large orders, their activity often appears in options flow data before price movements occur in the underlying asset.
The WAVE Indicator simplifies the interpretation of this complex data by highlighting situations where unusual options activity suggests institutional capital may be entering the market. Instead of manually reviewing thousands of contracts across strike prices and expiration dates, traders can rely on the WAVE Indicator to identify options flow patterns that may indicate institutional positioning.
How the WAVE Indicator Works
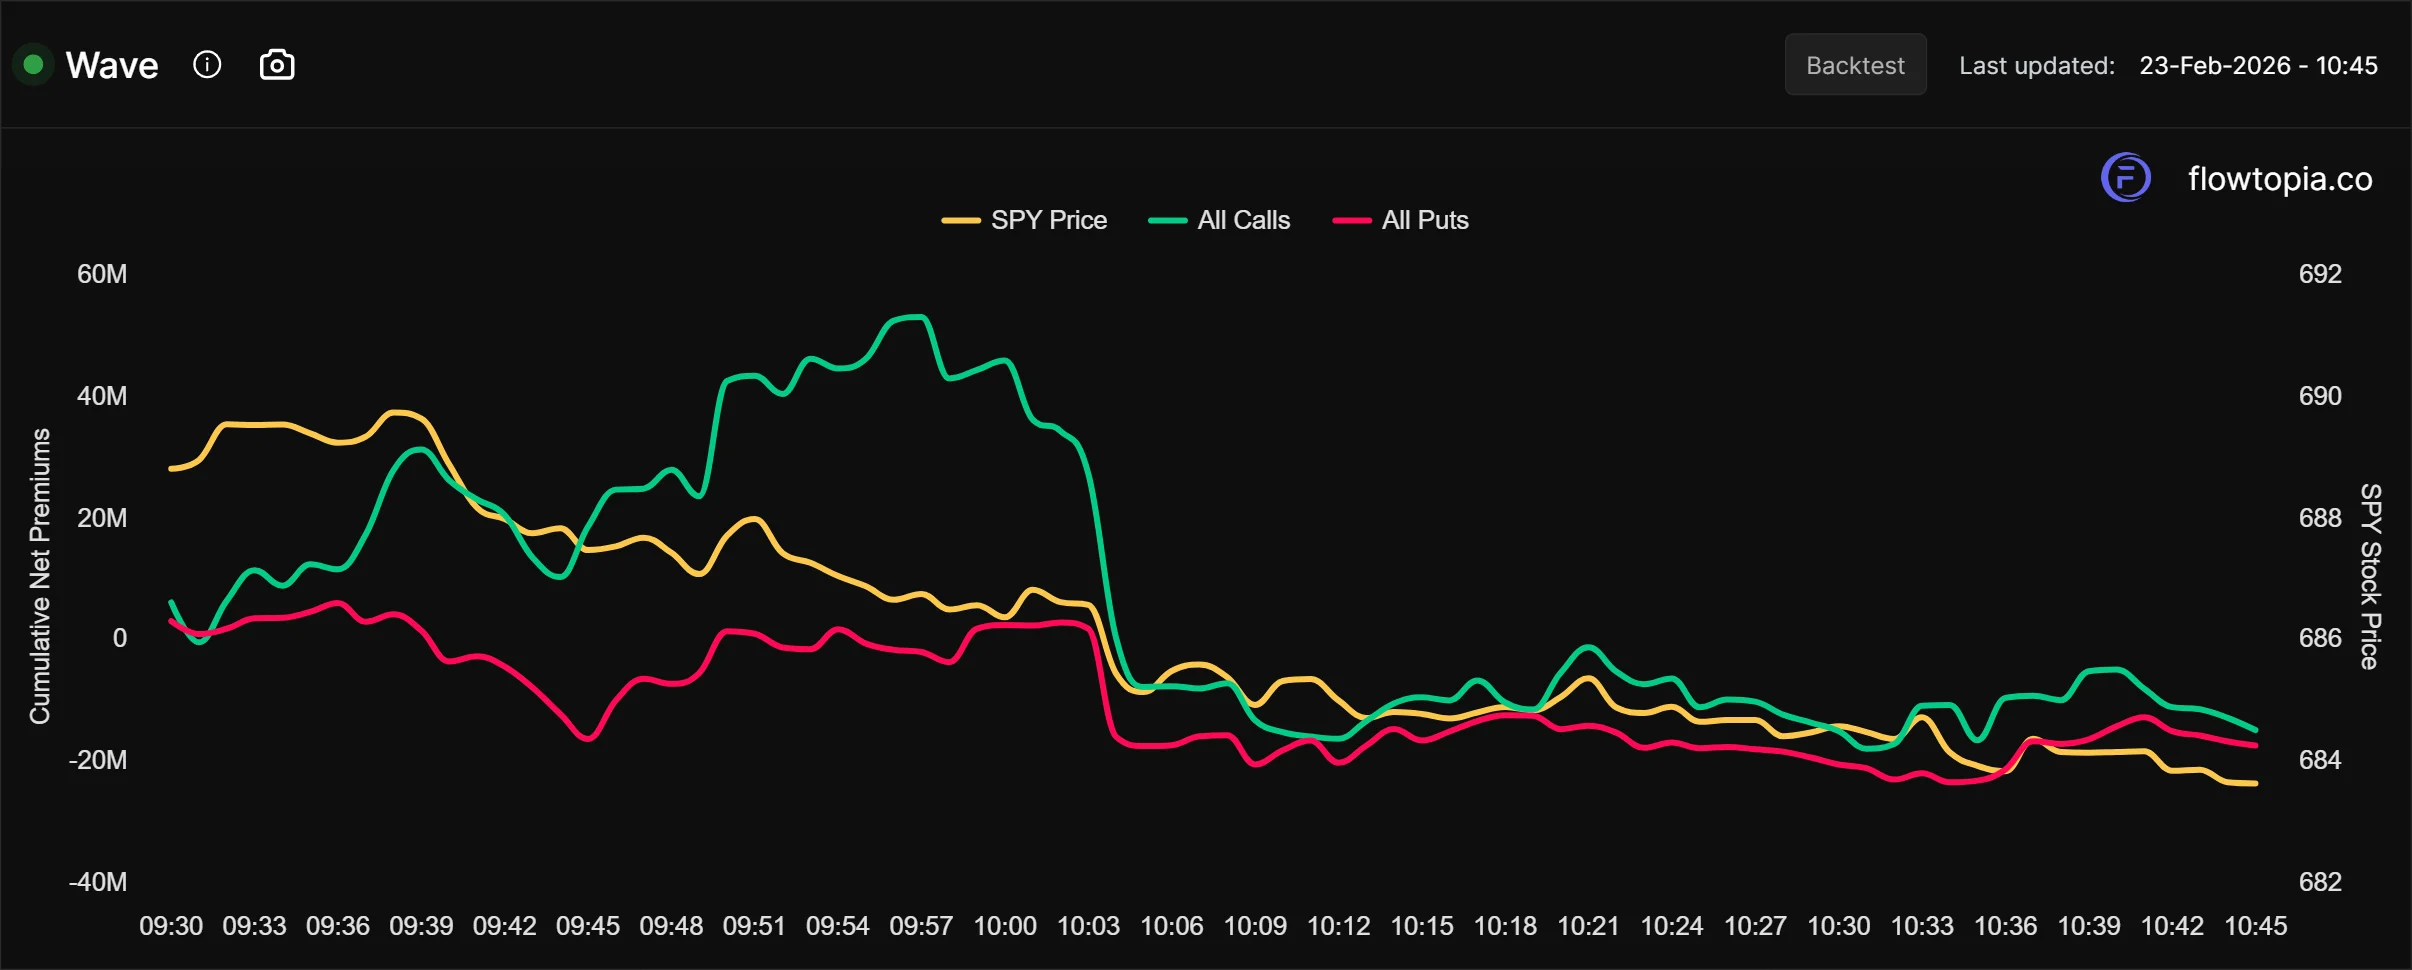
Options flow analysis focuses on understanding how capital moves through derivatives markets. The WAVE Indicator evaluates several important metrics to detect whether institutional investors are building positions.
Core Signals Used by the WAVE Indicator
- Net premium flowing into call and put contracts
- Aggressive sweep orders across multiple exchanges
- Volume relative to open interest levels
- Directional clustering of institutional trades
By combining these signals, the indicator converts complex derivatives activity into a clear visualization of institutional momentum.
This approach allows traders to focus on meaningful shifts in options activity instead of trying to interpret thousands of individual trades.
Options flow analytics are particularly powerful because they reveal where real capital is being deployed and highlight unusual options activity. When institutions commit large premiums to options contracts, their trades often reflect expectations about future market direction.
Data from the Chicago Board Options Exchange (CBOE) shows that options trading volume has grown dramatically over the past decade, making derivatives markets one of the most informative sources of sentiment data.
Strong institutional order flow appearing alongside rising volume and premium activity often signals that professional investors are positioning ahead of a potential market move.
Why Smart Money Flow Matters
Large market participants influence financial markets because they control substantial pools of capital and operate with advanced analytical capabilities.
The U.S. Securities and Exchange Commission (SEC) has repeatedly emphasized that institutional investors benefit from access to extensive research resources, advanced trading systems, and professional risk management frameworks. These advantages allow them to evaluate economic developments and corporate performance more effectively than many retail traders.
When large market participants begin building derivatives positions, their trades may reveal expectations about future price movements.
Major institutional funds often build options positions before major events such as earnings announcements, macroeconomic releases, or industry developments.
Monitoring changes in options market sentiment can help traders detect these shifts before they become visible on price charts.
Tracking smart money activity adds another layer of insight that traditional technical indicators often miss.
How Traders Use the WAVE Indicator
Experienced traders rarely rely on a single indicator when making trading decisions. Instead, they combine several analytical tools to develop a more complete understanding of market conditions.
The WAVE Indicator is commonly used alongside technical analysis to determine whether institutional participation supports a potential market move.
Common Uses of the WAVE Indicator
- Confirming momentum during breakout movements
- Detecting early institutional sentiment shifts
- Filtering out low-conviction options activity
For example, if a stock approaches a key resistance level while the WAVE Indicator shows increasing call option buying from institutional investors, traders may interpret this as confirmation that professional traders expect upward momentum.
When options flow indicators align with technical patterns or sector trends, traders often consider the setup to be stronger. To explore how Flowtopia’s analytics tools track institutional order flow across markets, visit the features page.
Real Example of Institutional Options Flow
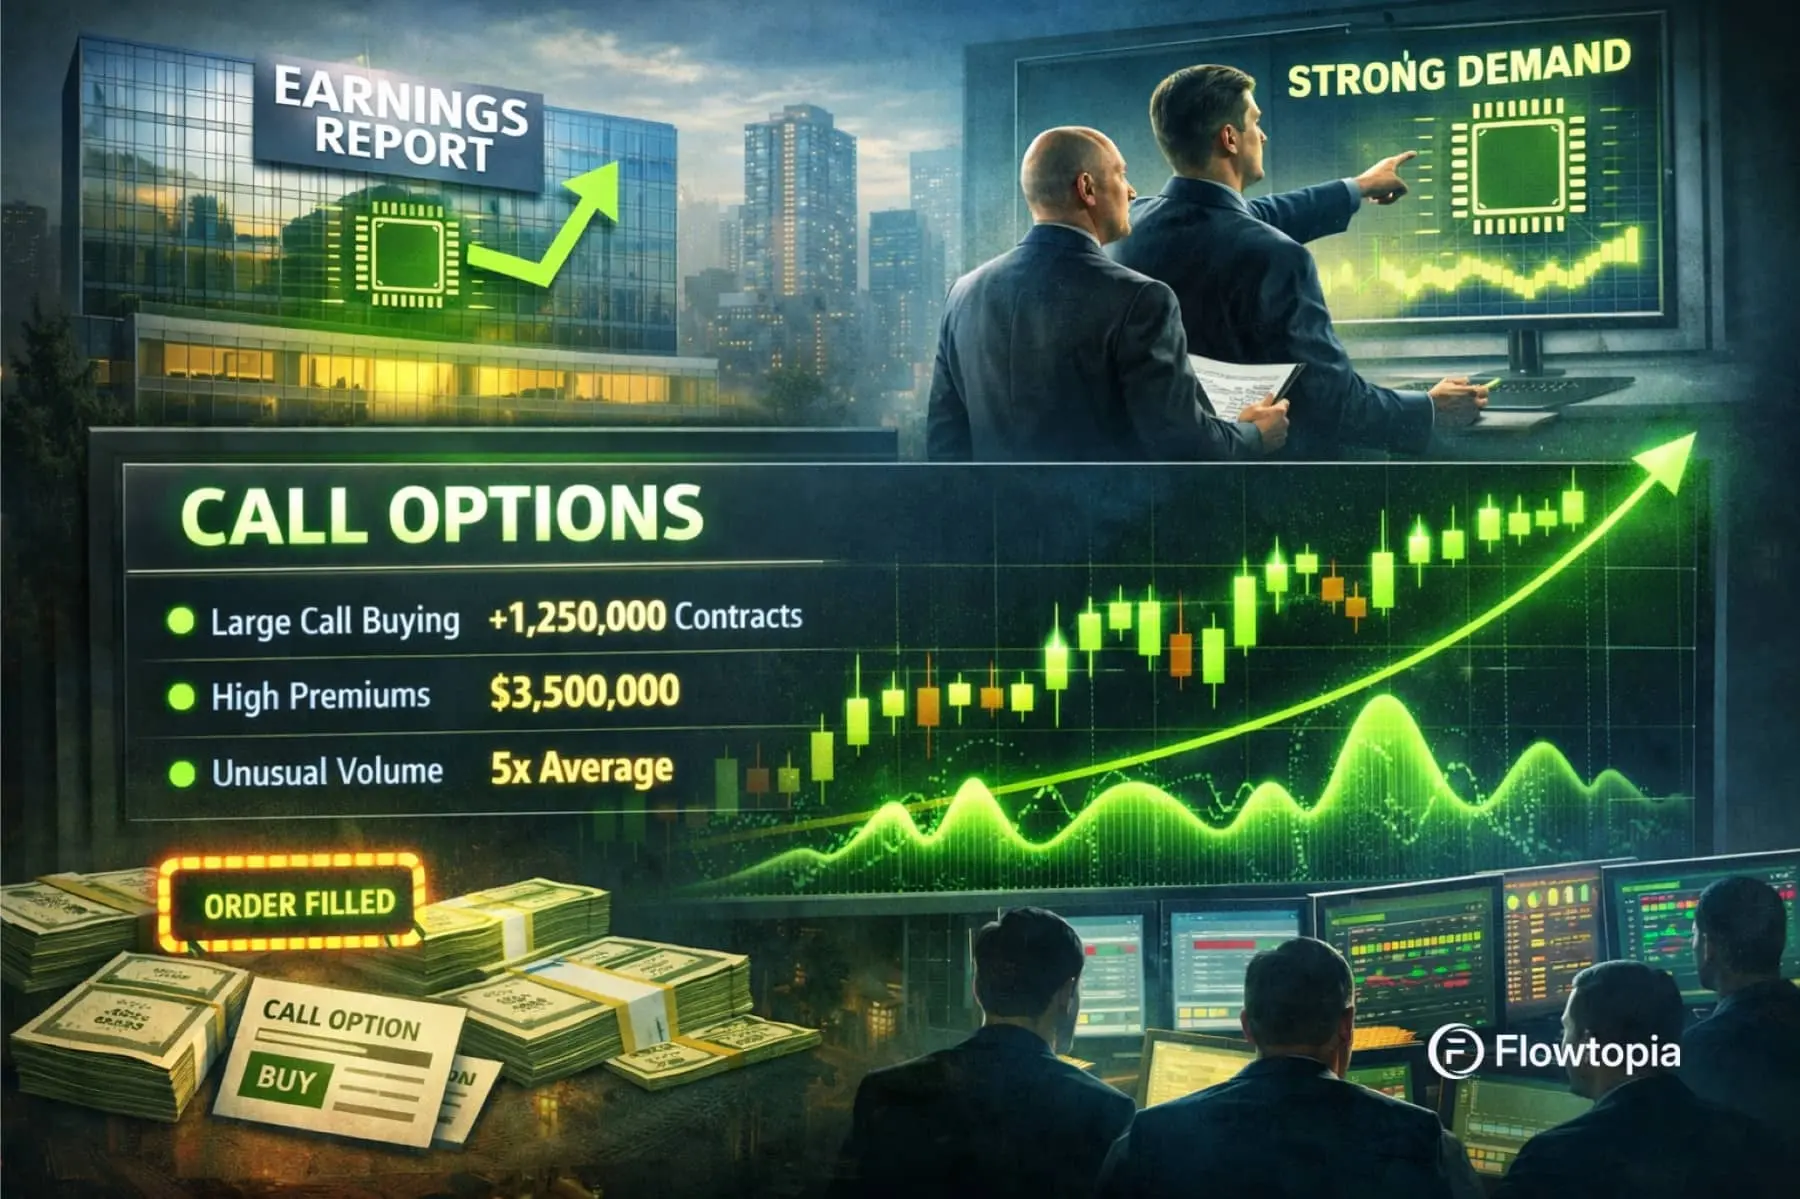
Imagine a large semiconductor company preparing to release quarterly earnings results.
Large institutional investors may believe the company will outperform expectations because of strong demand within the technology sector. Instead of purchasing shares directly, they might accumulate call options several weeks before the earnings announcement.
These positions could involve millions of dollars in premium and unusually high trading volume relative to open interest.
When this type of activity appears in options markets, indicators such as the WAVE Indicator may detect a surge in bullish institutional positioning. In many cases, this signal appears through unusual options activity, where trading volume or premium flow significantly exceeds historical averages.
Retail traders monitoring options flow indicators may observe this shift in sentiment before the broader market reacts.
These signals do not guarantee profitable trades, but they can offer valuable context when evaluating potential setups.
Understanding how institutional investors structure derivatives positions helps traders interpret market behavior more effectively.
Benefits of Smart Money Indicators
Options flow analytics platforms allow traders to interpret derivatives market data and identify unusual options activity that would otherwise be difficult to detect.
Advantages of Flow-Based Indicators
- Simplifying large volumes of options market data
- Highlighting unusual institutional trading activity
- Reducing noise created by smaller speculative trades
Without specialized analytics platforms, traders would need to review thousands of contracts across multiple exchanges to identify meaningful changes in options activity.
Flow indicators simplify this process by highlighting trades that may influence market direction.
You can explore the Flowtopia platform directly here: https://www.flowtopia.co/
Risks and Limitations
While smart money indicators provide valuable insight into institutional behavior, they should not be interpreted as guaranteed predictors of market direction.
Large options trades sometimes represent hedging strategies rather than speculative positions. Institutional investors frequently use derivatives to protect portfolio exposure rather than express directional expectations.
Because of this, traders should always evaluate options flow signals within the broader context of market conditions.
The Financial Industry Regulatory Authority (FINRA) also emphasizes that options trading involves substantial risk and requires a strong understanding of derivatives markets.
Effective risk management remains an essential component of any trading strategy.
Conclusion
Institutional capital plays a major role in shaping financial markets. Understanding how professional investors position themselves can provide valuable insight into potential price movements.
The WAVE Indicator simplifies institutional flow analysis by transforming complex options activity into a clear signal of market sentiment and institutional positioning. By analyzing premium flows, aggressive order activity, and volume relationships, the indicator helps traders identify meaningful shifts in institutional positioning.
While no indicator guarantees profitable trades, tools that reveal smart money activity can significantly improve a trader’s ability to interpret market behavior.
For traders seeking to understand how institutional activity influences derivatives markets, the WAVE Indicator provides a practical framework for tracking smart money flow and options market sentiment.
Similar Blog You
May Like
Understand how institutional money moves and turn complex options data into clear, actionable insights in real time.

Join traders using real-time options flow, institutional data, and advanced tools to make faster, more informed decisions.