

Blog Details

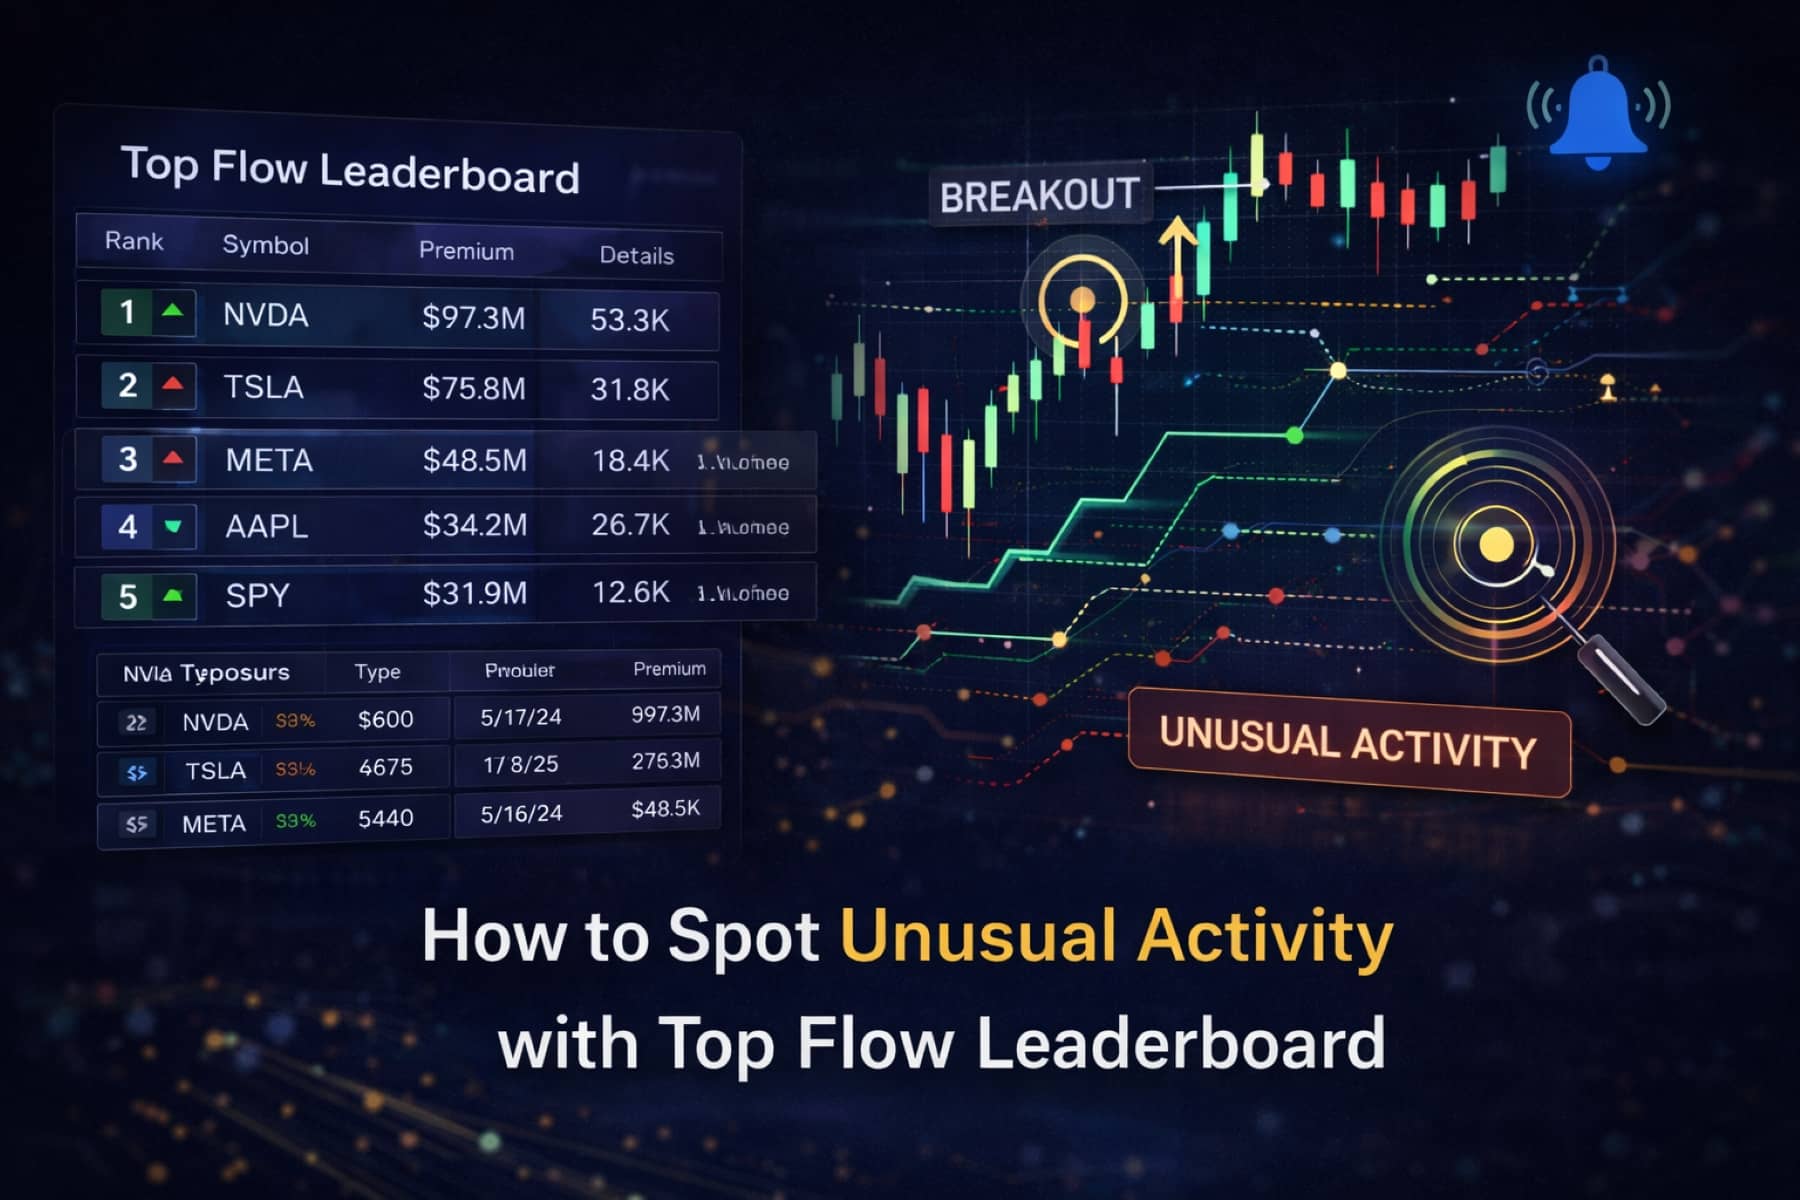
How to Spot Unusual Activity with Top Flow Leaderboard - Flowtopia
Not all important market activity shows up on price charts right away. In many cases, unusual options activity begins to build before that activity is fully reflected in price.
Large trades, sudden volume spikes, and repeated positioning at specific strikes can all provide additional context on where market attention may be shifting. But raw options flow can be difficult to interpret without structure.
That is where a tool like Top Flow Leaderboard becomes useful. Instead of scanning individual prints one by one, traders can use it to organize large and unusual options activity into a clearer view, making it easier to spot patterns, compare repeated trades, and focus on what may matter most during a session.
What Is Unusual Options Activity?
Unusual options activity generally refers to trades that stand out from normal market behavior. That may include unusually large contract size, sudden volume spikes, or repeated activity appearing over a short period of time.
Core Characteristics of Unusual Options Trades
Some of the most common signals include:
- unusually large options trades relative to recent averages
- sharp increases in volume without gradual buildup
- repeated trades at the same strike price
- elevated volume compared to open interest
These signals do not automatically indicate direction, but they can point to areas where market participants are becoming more active.
Understanding the Broader Context
Unusual options activity is often viewed within the broader context of options flow, since flow data can help show how capital is being distributed across contracts and expirations.
Still, interpretation requires caution. A large trade may reflect directional positioning, but it may also be part of a hedge, spread, or volatility strategy. For that reason, many traders focus less on isolated transactions and more on how similar activity develops over time.
What Is an Options Flow Leaderboard?
An options flow leaderboard is a tool that helps organize and rank notable options trades based on factors such as premium, size, volume, or unusual activity.
Instead of scanning raw flow one trade at a time, traders can use a leaderboard to quickly surface the contracts that stand out most during a session.
How Leaderboards Organize Data
Most leaderboards highlight:
- the largest options trades by premium
- contracts with elevated volume
- repeated activity at key strike prices
- trades sorted by execution characteristics
This kind of structure can make it easier to quickly spot trades that stand out from normal activity rather than getting lost in noise.
Why It Improves Analysis
Without a structured view, unusual options activity can be easy to miss or difficult to prioritize in real time. A leaderboard helps surface the trades that stand out first, allowing traders to focus on the activity that may deserve closer attention.
It also supports a more consistent workflow by making it easier to compare trades, spot repetition, and avoid reacting to every isolated print.
How Traders Identify Large Options Trades
Large options trades are often one of the first things traders notice when scanning for unusual activity, but size alone does not always make a trade meaningful.
To evaluate whether a trade stands out, traders often compare it with:
- average daily volume
- open interest
- recent contract activity
Execution can also add context. Trades filled closer to the ask may reflect more aggressive participation, while trades near the bid may suggest a different type of positioning. Timing matters as well, since repeated large trades appearing within a short period may carry more weight than a single isolated print.
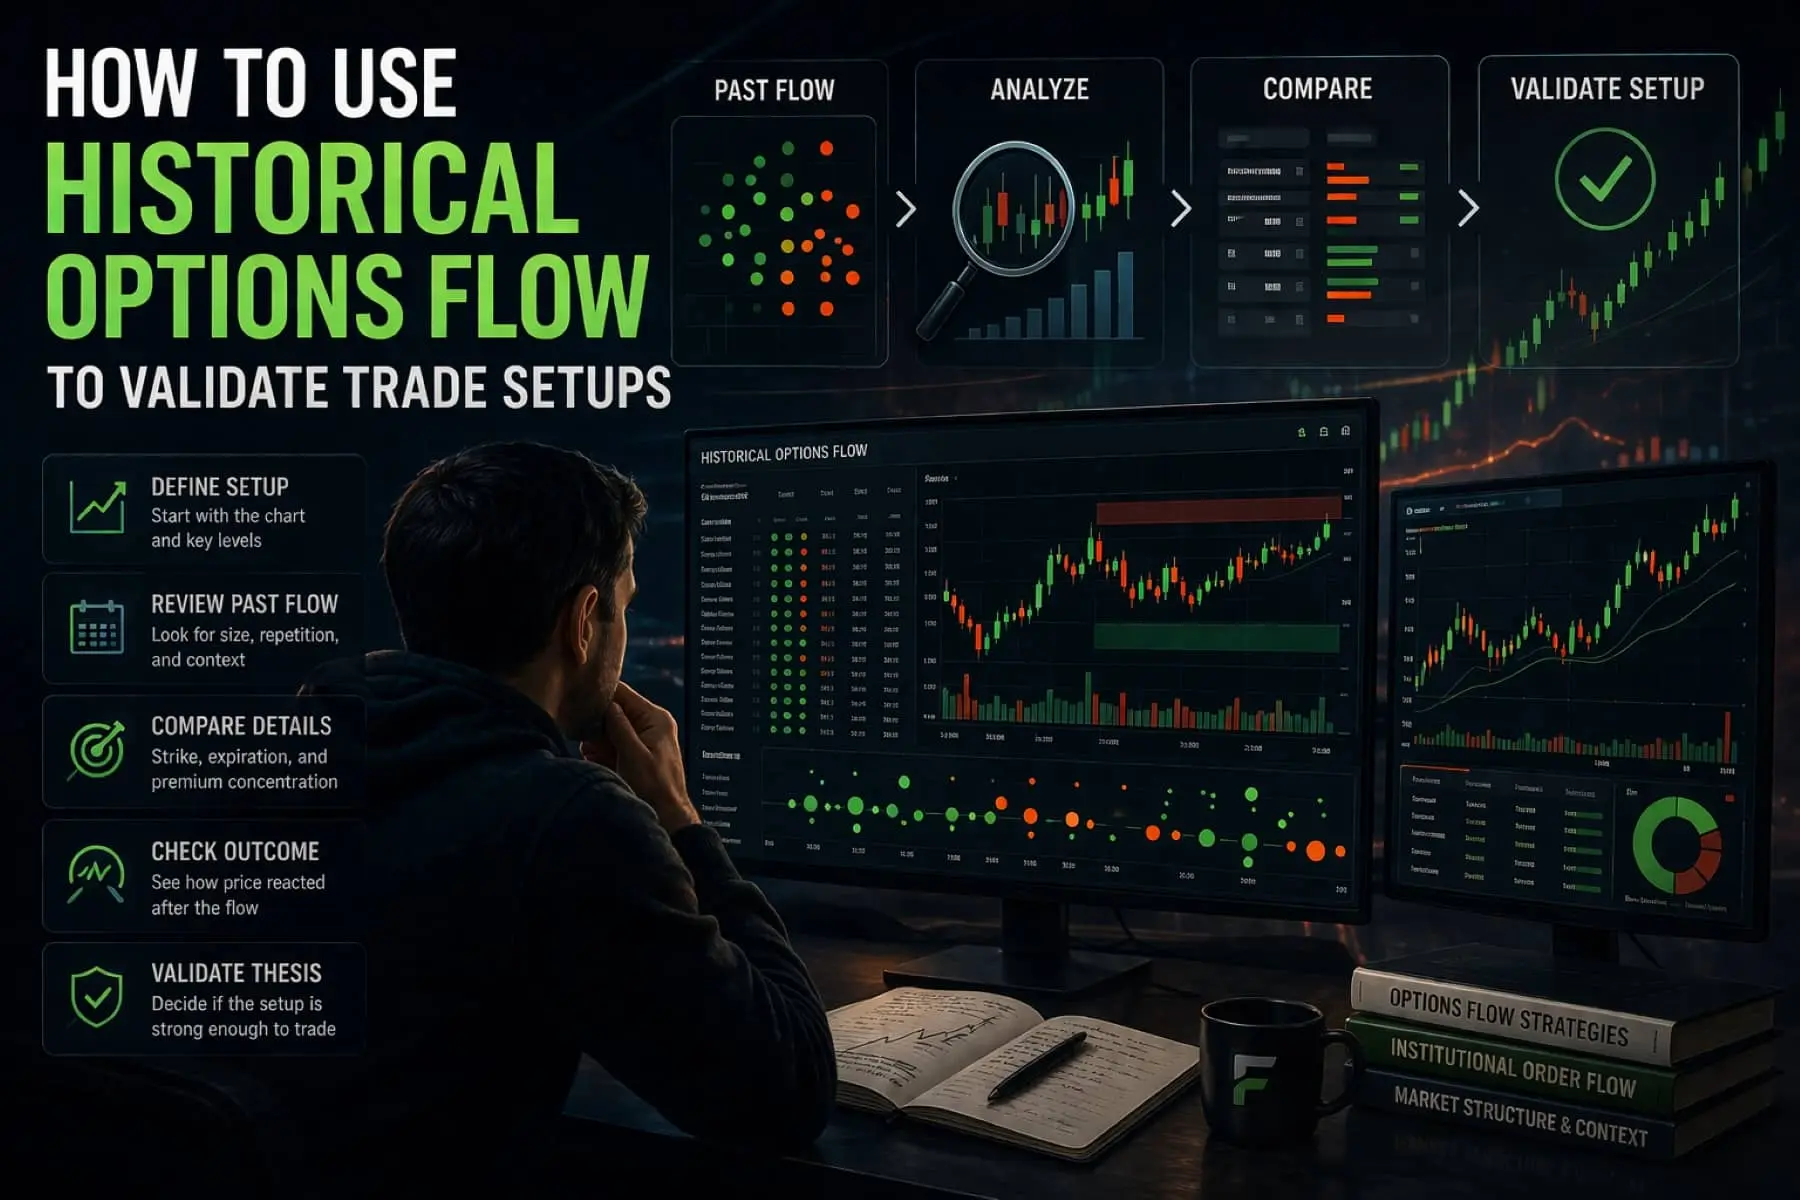
Using a Top Flow Leaderboard to Spot Unusual Activity
Top Flow Leaderboard helps traders spot unusual activity more efficiently by organizing large and notable options trades into one structured view. Instead of scanning raw flow line by line, traders can use the leaderboard to quickly identify where meaningful activity may be building and then evaluate it with more context.
Step 1: Identify High Premium Trades
Traders often begin by scanning for high-premium trades, since these contracts usually stand out first on the leaderboard. While premium alone does not confirm intent, it can help highlight where larger capital commitments are appearing.
Step 2: Look for Repeated Activity
Repeated activity at the same strike or expiration often carries more weight than a single large print. When similar trades continue to appear, it may suggest more sustained interest rather than one isolated transaction.
Step 3: Analyze Expiration Structure
Expiration structure can add important context. Activity concentrated in short-dated contracts may reflect a more immediate view, while repeated flow across later expirations may suggest a broader or more sustained positioning theme.
Step 4: Add Market Context
Flow data becomes more useful when viewed alongside price, volatility, and nearby market events. This added context can help traders judge whether the activity appears more relevant or simply less significant within the broader setup.
Step 5: Avoid Overinterpreting Signals
Not every unusual trade carries a clear signal. Many transactions are part of multi-leg strategies, hedges, or broader volatility positions that cannot be fully understood on their own.
For that reason, it is often more useful to track how patterns develop over time rather than react immediately to a single print.
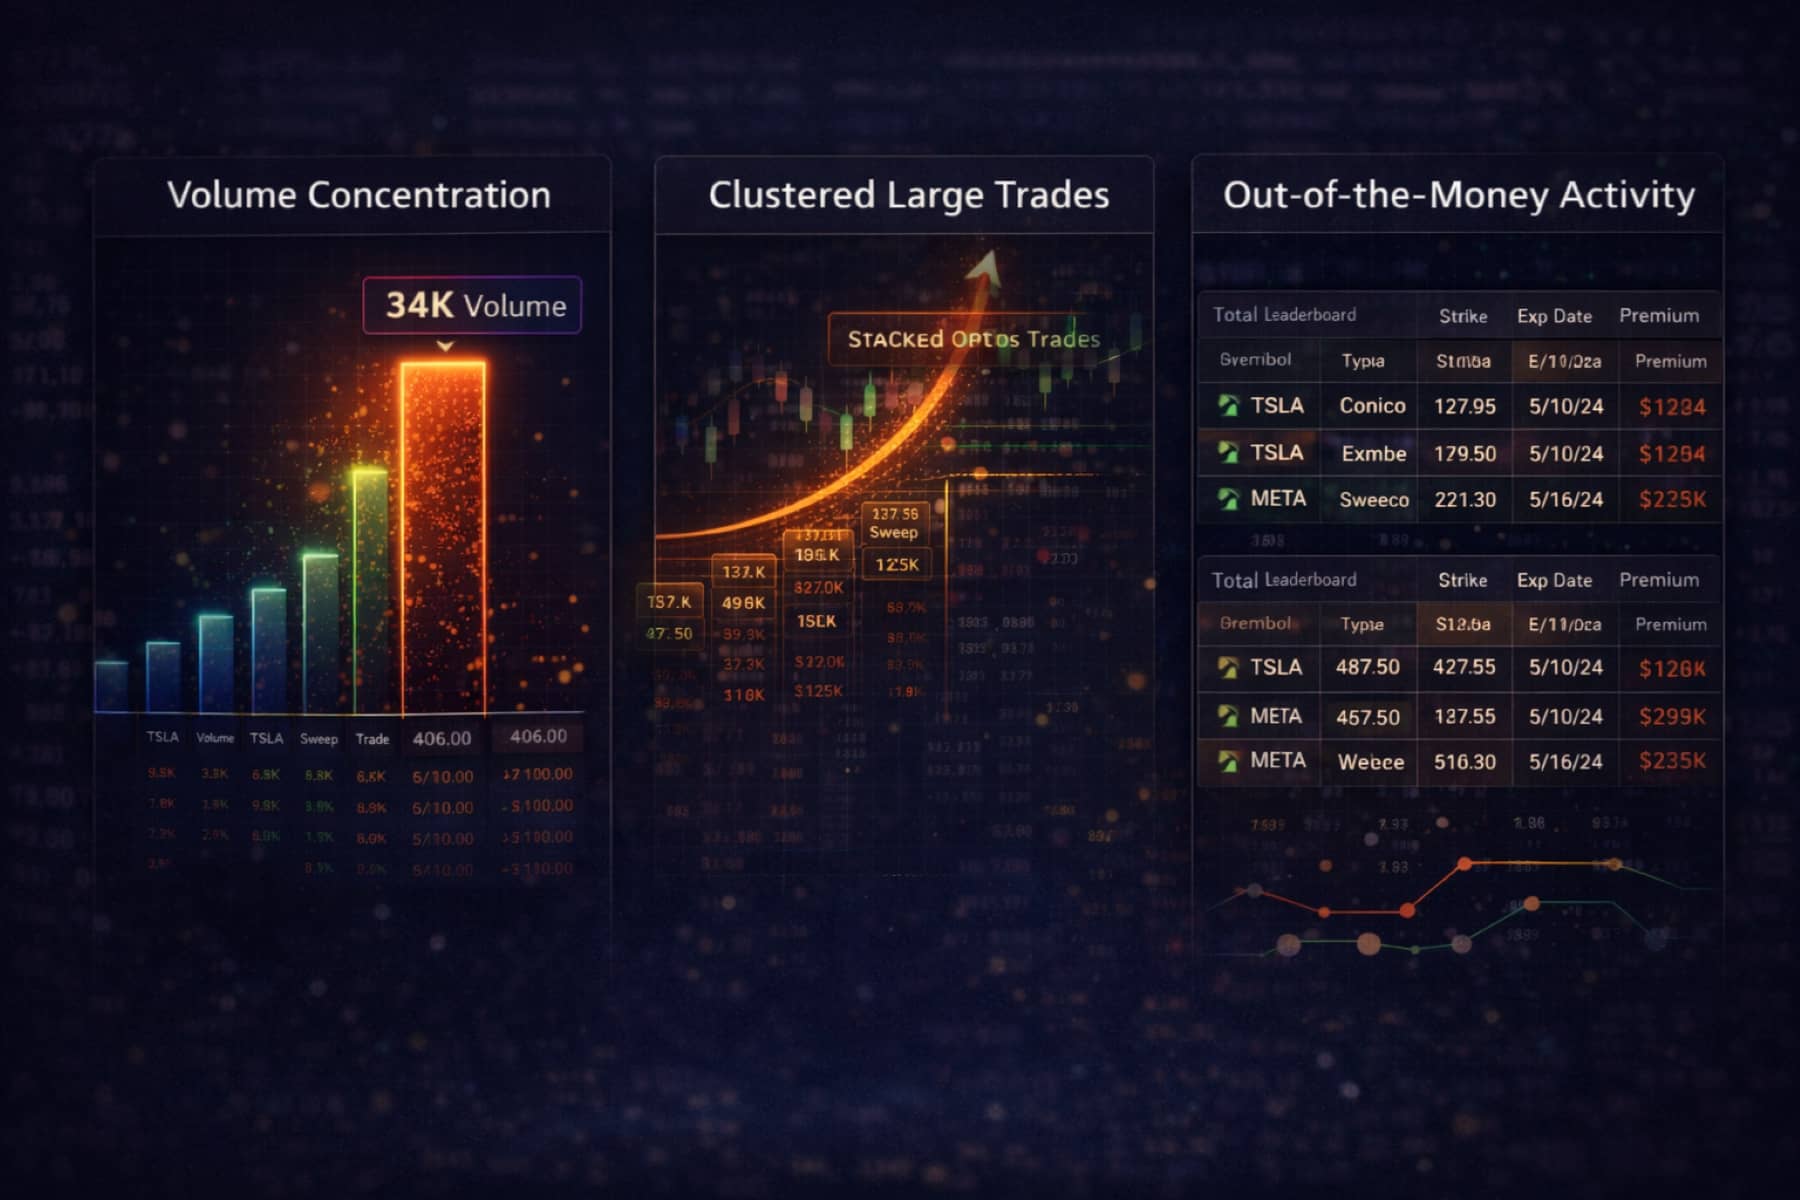
Common Patterns in Unusual Options Activity
Certain patterns tend to appear more often when unusual options activity starts to build. These patterns do not provide certainty, but they can help traders decide where to look more closely inside Top Flow Leaderboard.
Volume Concentration
Sudden increases in volume at a specific strike may suggest growing attention around that level, especially when the same contract continues to appear on the leaderboard.
Clustered Large Trades
Multiple large trades appearing within a short period can suggest more deliberate positioning, particularly when they are concentrated around the same strike or expiration.
Out-of-the-Money Activity
Unusual activity in out-of-the-money contracts can sometimes reflect speculative positioning, especially around catalysts such as earnings or macro events, although intent is not always clear.
These patterns often become more noticeable around key events such as earnings announcements or macro releases. Some traders also track whether similar activity continues across multiple sessions, since repeated flow over time may suggest more sustained positioning rather than short-term speculation.
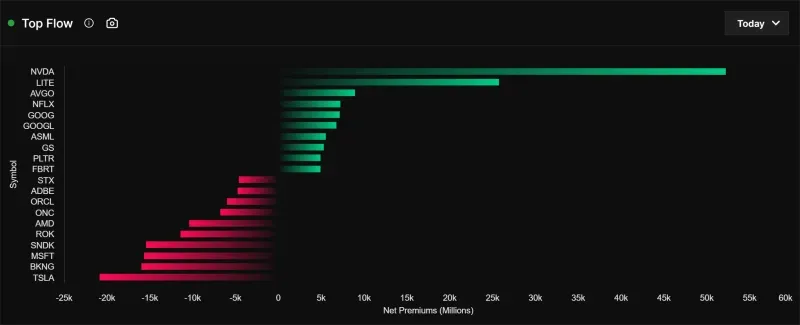
Combining Leaderboard Data with Additional Tools
To build a more complete view of market behavior, traders often use Top Flow Leaderboard alongside additional tools.
For example, contract-level execution views can help clarify how large trades were filled, while historical flow analysis can show whether similar activity has appeared before. Broader positioning tools can also add context around how that activity may fit into the larger market structure.
Viewed together, these tools can make it easier to understand not just where unusual activity is appearing, but how it connects to the broader flow environment.
Limitations of Tracking Unusual Options Trades
Despite its usefulness, unusual options activity has clear limitations. Not every unusual trade leads to a meaningful outcome, which is why context remains essential.
Incomplete Information
Many options trades are part of complex strategies, meaning a single trade does not reveal the full position.
Ambiguity of Intent
A trade that appears directional may actually be part of a hedge or volatility strategy.
Changing Market Conditions
Market conditions can shift quickly, and activity that appears meaningful in one environment may carry less weight in another.
Because of this, traders often revisit their interpretations as new data becomes available.
Real-World Example of Leaderboard Analysis
To understand how Top Flow Leaderboard might be used in practice, consider a highly traded stock where repeated call activity begins to build at the same strike during a single session.
A trader notices:
- multiple high-premium trades
- elevated volume at one strike
- repeated activity appearing over a short period
If the stock is trading near that level, or if a catalyst such as earnings is approaching, the activity may deserve closer attention. If the same flow continues to appear into the next session, that may add further context.
In this kind of setup, Top Flow Leaderboard does not provide certainty on its own. What it does provide is a faster way to identify where activity is building so the trader can investigate it with more structure and discipline.
Best Practices for Using an Options Flow Leaderboard
Using Top Flow Leaderboard effectively requires a consistent process rather than a reaction to isolated trades.
1️⃣ Repeated activity often provides more useful context than a single trade, especially when the same strike or expiration continues to stand out.
2️⃣ Using additional tools alongside Top Flow Leaderboard can provide broader context and improve interpretation.
3️⃣ Market conditions evolve quickly, so trade interpretation should adjust as new data, price action, and volatility conditions change.
Building Better Insight Over Time
For traders who review options flow regularly, one useful habit is tracking whether unusual activity continues to appear at the same levels across multiple sessions. Over time, that process can improve pattern recognition and help distinguish between short-lived activity and more sustained positioning.
This does not create instant signals, but it can improve decision-making by adding more context to future observations.
Conclusion
Unusual options activity does not provide certainty, but it can help highlight where market attention and positioning may be building.
Top Flow Leaderboard makes that process more structured by helping traders surface notable trades, compare repeated activity, and focus on the patterns that may deserve closer attention.
Rather than reacting to isolated prints, traders often get more value by combining leaderboard data with context, repetition, and discipline over time.
Similar Blog You
May Like
Understand how institutional money moves and turn complex options data into clear, actionable insights in real time.

Join traders using real-time options flow, institutional data, and advanced tools to make faster, more informed decisions.