
Find the same contract hit aggressively, again and again
Repeat Flow


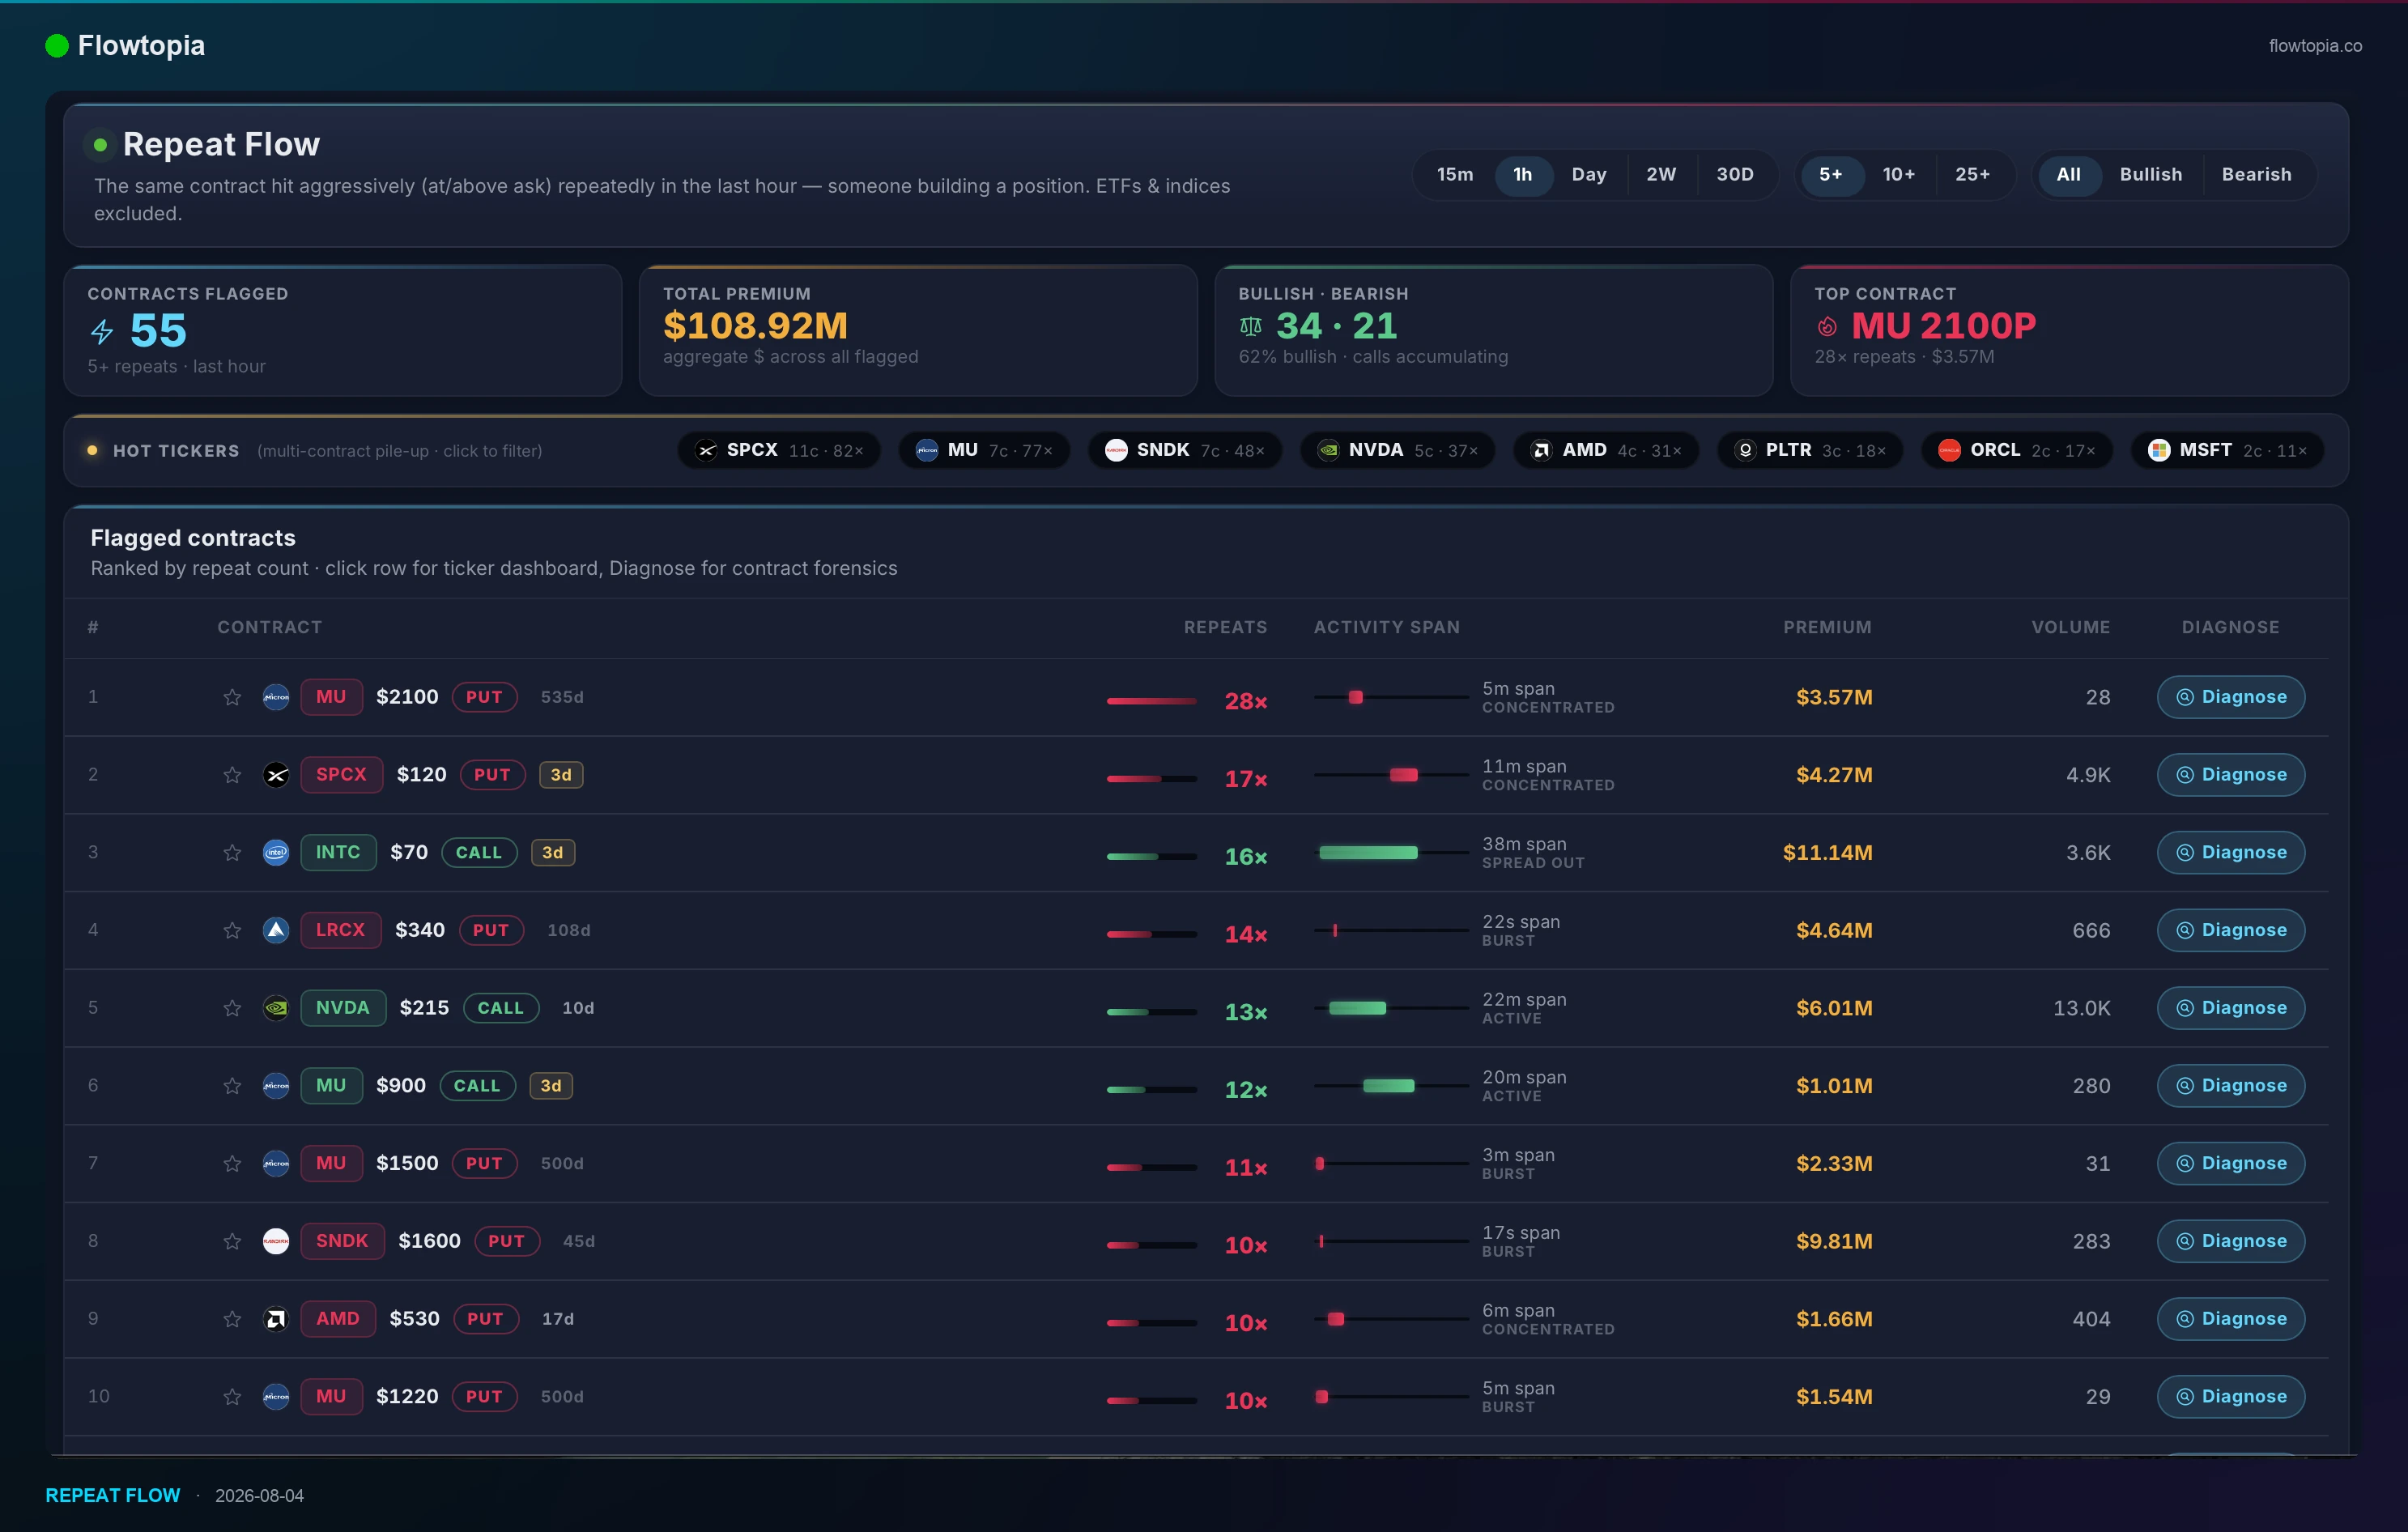
Repeat Flow finds the exact same option contract — same ticker, same strike, same expiration, same side — being bought aggressively over and over inside a window you choose. It groups every print at or above the ask by contract, counts the repeats, and ranks what's piling up. Rather than showing you one large trade, it shows you the pattern of someone working an order in. You can scan the last 15 minutes, the last hour, the full session, or a 2-week / 30-day swing window, with a minimum repeat threshold of 5, 10 or 25 hits.
The premise is simple: a single big print is one decision. Forty prints on the same contract in twenty minutes is a campaign.
Because of how large orders actually get filled.
If you genuinely want to buy $5 million of a single option contract, you cannot just hit send. The displayed size on most contracts is a few hundred at best. One giant market order would sweep through every offer on the book, move the option's price several ticks against you, and announce your position to every algorithm watching the tape. So institutional flow gets worked: broken into pieces, fed in over minutes, hours, or days, often across multiple exchanges.
That behaviour leaves a fingerprint — the same contract, hit repeatedly, aggressively, in a compressed span. Repeat Flow is built to find that fingerprint.
There's a second reason repetition beats size. One large print is genuinely ambiguous. It could be a hedge against a stock position. It could be one leg of a spread with the offsetting leg printing at the same moment. It could be a roll — closing an expiring position and opening a new one. It could be a market maker laying off inventory. Every options-flow platform, including this one, shows you big prints, and a meaningful share of them are not directional bets by anyone.
Sustained one-sided repetition is harder to explain away. Someone deliberately paying the offer forty separate times on one strike has a view. You still don't know whose view it is, or whether they're right, but the intent is far less ambiguous than a single block.
Each row is one contract that cleared your repeat threshold. What to look at:
Two filtering notes. ETFs and index products are excluded — repeat hedging flow on SPY is constant background noise, and leaving it in would drown out everything else. And only aggressive buys count: prints at the ask, above the ask, or to the ask. Someone paying up to get filled is expressing urgency in a way that a passive mid-price fill is not.
Outside market hours the day-window views show the most recent completed session rather than going blank, so you can review Friday's accumulation over the weekend.
These three tools answer different questions about the same tape, and they're strongest read together.
Cheaplies + LEAPS is two leaderboards. Cheaplies are contracts trading under $2.00 per option — under $200 for a standard contract — bought aggressively. Tiny per-contract cost, enormous leverage if the underlying cooperates, and a very high likelihood of expiring worthless. LEAPS are contracts 365+ days out, filtered to the directional moneyness zones (somewhat in-the-money, or far out-of-the-money) so routine near-the-money hedging flow is stripped out and what's left is long-horizon conviction.
Here's the combination that matters. Both leaderboards are ranked by total premium, so they'll happily surface a contract where one person paid up once. Run the same contract through Repeat Flow and you learn whether that premium arrived as a single decision or as a sustained campaign.
A practical workflow: scan Repeat Flow on the 1-hour window for live pile-ups, widen to 2W / 30D to find pre-catalyst position-building, cross-reference Cheaplies + LEAPS to understand what kind of bet it is, open Diagnose to verify the prints are genuinely one-sided, then check News & Calendar for a scheduled catalyst that might explain the timing.
Worth being direct about the limits:
Options trading involves substantial risk, including the total loss of premium paid. Flowtopia is a research and data platform — it surfaces market activity so you can do your own analysis. It does not provide investment advice or recommendations, and nothing on the platform is a suggestion to buy or sell any security.
Repeat Flow, its Diagnose view, and Cheaplies + LEAPS are part of every Flowtopia plan alongside all fifteen live tools — $45/month, $350/year (about $29/mo, saving $190 versus monthly), or $1,500 lifetime one-time. Options data comes from OPRA via Intrinio; news and the economic calendar come from Benzinga; earnings and IPO calendars come from Finnhub.
What is repeat options flow? Repeat options flow is the same exact contract — same underlying, strike, expiration and side — being traded aggressively multiple times in a short period. It's associated with a large order being worked into the market in pieces rather than filled all at once, since a single oversized order would move the option's price and reveal the position.
Why is repeated buying more meaningful than one large options trade? A single large print is ambiguous: it could be a hedge, one leg of a spread, a roll, or market-maker inventory. Sustained one-sided repetition on the same contract is harder to explain as anything other than deliberate position-building. It's about intent being clearer, not about any particular outcome.
What window should I use in Repeat Flow? 15-minute and 1-hour windows catch live pile-ups happening right now — the sharpest read for intraday trading. The full-day window gives session context. The 2-week and 30-day swing windows surface slower pre-catalyst position-building and add an open-interest change column that confirms whether new positions are actually being opened.
Why are SPY and other ETFs excluded from Repeat Flow? Repeat hedging activity on index ETFs is essentially constant. Leaving SPY and similar products in would fill the entire table with routine hedging flow and bury the single-name activity the tool is designed to find.
How does Repeat Flow work with Cheaplies + LEAPS? Cheaplies + LEAPS ranks contracts by total premium, which can be driven by one large trade. Repeat Flow tells you whether that premium arrived as a single decision or a sustained campaign. A sub-$2 contract with hundreds of aggressive repeats, or a 365+ DTE contract accumulating over weeks with rising open interest, is a far more complete picture than either tool alone.
Does high repeat flow mean a stock will go up? No. Repeat Flow reports activity that has already occurred on the tape. It doesn't identify who is trading, whether the position is a hedge, or whether the trader is right. It's information for your own analysis — not a prediction and not a recommendation.
Join traders using real-time options flow, institutional data, and advanced tools to make faster, more informed decisions.